How to Value a Stock: Complete Stock Valuation Guide
How to Value a Stock: A Complete Guide to Stock Valuation and Intrinsic Value
Understanding how to value a stock is one of the most important skills in fundamental investing. A stock’s market price tells you what investors are currently willing to pay, but it does not necessarily tell you what the underlying business is worth.
Stock valuation attempts to answer a different question:
“Based on the company’s financial performance, future cash flows, growth potential and risk, what might this business be worth?”
There is no single formula that works perfectly for every company. Investors commonly use relative valuation methods such as P/E and EV/EBITDA, as well as intrinsic valuation methods such as discounted cash flow (DCF) and dividend discount models.
The goal of valuation is therefore not to predict an exact future stock price. It is to build a reasonable estimate of value, understand the assumptions behind it, and determine how much uncertainty exists around that estimate.
Table of Contents
What Does It Mean to Value a Stock?
Stock valuation is the process of estimating the economic or intrinsic value of a company’s shares and comparing that estimate with the current market price.
There are two concepts you need to understand first:
Market price is the price at which the stock currently trades.
Intrinsic value is an estimate of what the underlying business may be worth based on its financial performance, assets, cash flows, growth prospects and risks.
For example, suppose a company’s shares trade at ₹500, but after analyzing the business you estimate that its reasonable value is somewhere between ₹600 and ₹700.
That could indicate that the shares are trading below your estimated value.
But there is an important qualification: your ₹600–₹700 estimate is not a fact. It is the output of assumptions and a valuation methodology.
That distinction is fundamental to understanding stock valuation.
Why Is Stock Valuation Important?
A company’s stock price can move because of earnings announcements, interest rates, economic conditions, investor sentiment, news and expectations about the future.
The underlying economics of a business usually change much more slowly.
Valuation gives investors a framework for connecting the two.
Suppose two companies both earn ₹10 per share.
- Company A trades at ₹100.
- Company B trades at ₹500.
Their P/E ratios are 10 and 50 respectively.
That does not automatically mean Company A is better or Company B is overpriced. Company B might have substantially higher growth, stronger competitive advantages, better returns on capital or more predictable future cash flows.
This is why valuation should never be reduced to simply finding the lowest P/E ratio.
A useful way to think about it is:
Business quality + future economics + risk + price = investment analysis
Valuation helps you understand the price relative to those economics.
Market Price vs. Intrinsic Value: What’s the Difference?
What is market price?
Market price is the price at which buyers and sellers currently agree to transact.
It incorporates millions of investors’ expectations about the company’s future.
That price can change dramatically even when the company’s underlying business has changed very little.
What is intrinsic value?
Intrinsic value is an estimate based on the economic characteristics of the business.
Depending on the method, it may be based on:
- Future free cash flow
- Earnings
- Dividends
- Assets
- Comparable companies
- Growth
- Profitability
- Risk
Financial valuation frameworks commonly distinguish between intrinsic/absolute valuation and relative valuation.
What does undervalued mean?
A stock may be considered potentially undervalued when your reasonable estimate of its value is higher than its current market price.
For example:
- Estimated value: ₹800
- Market price: ₹600
The difference doesn’t guarantee that the stock will rise to ₹800.
Your assumptions could be wrong.
What does overvalued mean?
A stock may be considered potentially overvalued when the market price is significantly above your reasonable estimate of its value.
Again, that does not mean the price must fall immediately.
A stock can remain expensive for years if the underlying business continues to grow or investor expectations remain high.
Why intrinsic value is not one exact number
This is one of the most important concepts in valuation.
Imagine two analysts valuing the same company.
One assumes:
- 15% revenue growth
- 25% operating margin
- 10% discount rate
Another assumes:
- 10% revenue growth
- 21% operating margin
- 12% discount rate
They can arrive at very different valuations while both models are mathematically correct.
The difference comes from the assumptions, not the arithmetic.
Therefore, serious investors should generally think in terms of a valuation range, rather than pretending that a company is worth exactly ₹742.36 per share.
What Information Do You Need Before Valuing a Stock?
Before calculating any valuation ratio, understand the company.
A spreadsheet cannot compensate for a poor understanding of the business.
Understand the company’s business model
Start by answering simple questions:
What does the company sell?
Who are its customers?
How does it make money?
What determines demand?
What are its major costs?
Who are its competitors?
Does the company have any durable competitive advantage?
A company with rapidly growing revenue but permanently weak economics may be less valuable than a slower-growing company with strong margins and excellent returns on capital.
Examine the income statement
Look at the company’s:
- Revenue
- Operating profit
- Operating margin
- Net profit
- EPS
Don’t focus only on the latest year.
Look at the trend.
Is revenue consistently increasing?
Are margins expanding or contracting?
Is profit growing faster than revenue?
Are earnings highly volatile?
These questions are more informative than a single P/E number.
Examine the balance sheet
The balance sheet helps you understand financial strength.
Pay attention to:
- Cash
- Debt
- Net debt
- Working capital
- Shareholders’ equity
A company with ₹1,000 crore of operating profit and ₹10,000 crore of debt has a very different risk profile from a company with the same operating profit and a net cash position.
Debt also explains why enterprise-value-based metrics can sometimes provide useful information that P/E alone doesn’t capture.
Examine the cash-flow statement
Profit is not the same thing as cash.
A company can report strong accounting earnings while generating weak cash flow because of working-capital requirements, capital expenditure or other factors.
Look at:
Operating Cash Flow
and
Free Cash Flow
Free cash flow is particularly important in valuation because ultimately the economic value of a business depends on the cash it can generate and distribute or reinvest over time.
DCF valuation explicitly focuses on future cash flows and their present value.
Look at several years of financial history
A single year can be misleading.
Ideally, examine several years of:
- Revenue
- EPS
- Operating margin
- Free cash flow
- Debt
- Return on capital
- Shares outstanding
This can reveal whether the latest results represent a genuine long-term trend or simply an unusually good or bad year.
The Main Stock Valuation Methods
Stock valuation can broadly be divided into relative valuation and intrinsic valuation.
Relative valuation
Relative valuation asks:
“How expensive or cheap is this company compared with similar companies?”
Common methods include:
- P/E
- P/B
- P/S
- PEG
- EV/EBITDA
- Free cash flow yield
Comparable-company analysis is widely used because it provides an observable market-based reference point. (Corporate Finance Institute)
Intrinsic valuation
Intrinsic valuation instead asks:
“What is this business worth based on the economic benefits it can generate?”
Common approaches include:
- Discounted Cash Flow
- Dividend Discount Model
- Other earnings or cash-flow-based approaches
The important point is that no single method is universally best.
The appropriate method depends on the company’s business model, financial structure and predictability.
How to Value a Stock Using the P/E Ratio
The Price-to-Earnings ratio, or P/E, is one of the most widely used valuation metrics.
P/E formula
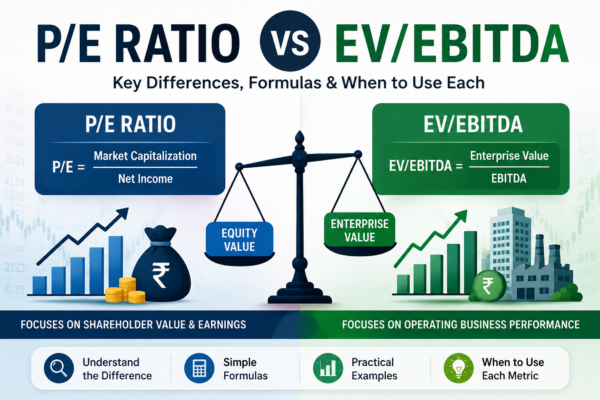
P/E = Share Price ÷ Earnings Per Share
For example, suppose:
- Share price = ₹200
- EPS = ₹10
Then:
P/E = ₹200 ÷ ₹10 = 20
The market is therefore valuing the company at 20 times its current earnings.
Example of P/E valuation
Suppose a fictional company has EPS of ₹15.
You determine that comparable companies with similar growth, profitability and risk trade around 20 times earnings.
A simple relative valuation would be:
Estimated value = ₹15 × 20 = ₹300
If the stock trades at ₹240, the shares appear cheaper than your ₹300 estimate.
But this conclusion depends heavily on whether 20× is actually an appropriate multiple.
That is where fundamental analysis comes in.
What is a good P/E ratio?
There is no universally good P/E ratio.
A P/E of 10 could be expensive for a company whose earnings are about to collapse.
A P/E of 40 could potentially be reasonable for a company with:
- High growth
- High returns on capital
- Strong competitive advantages
- Low financial risk
- Predictable future cash flows
The correct question isn’t:
“Is a P/E of 20 cheap?”
It is:
“Is this P/E reasonable given the company’s growth, profitability, quality and risk?”
Trailing P/E vs. Forward P/E
Trailing P/E uses historical earnings.
Forward P/E uses estimated future earnings.
Forward P/E can be useful because stock prices reflect expectations about the future.
But it also introduces another source of uncertainty: the forecast itself may be wrong.
If analysts expect EPS of ₹20 but actual EPS turns out to be ₹12, a supposedly cheap forward P/E can suddenly become much higher.
When does P/E work well?
P/E is generally more useful when the company:
- Has positive earnings
- Has reasonably stable earnings
- Has a business model comparable with its peers
- Doesn’t have unusually large one-time gains or losses
When can P/E be misleading?
P/E becomes less useful when:
- Earnings are negative
- Earnings are highly cyclical
- There are large one-time gains
- There are large restructuring charges
- Accounting earnings don’t represent underlying economics
- The company is undergoing major changes
This is why valuation multiples should be used with context rather than in isolation. (Corporate Finance Institute)
Other Valuation Multiples You Should Know
Price-to-Book Ratio (P/B)
P/B = Market Price Per Share ÷ Book Value Per Share
P/B compares a company’s market value with the accounting value of its net assets.
It can be particularly useful for certain financial and asset-heavy businesses.
But book value is much less informative for some asset-light companies whose most valuable assets—such as intellectual property, brands and networks—may not be fully represented on the balance sheet.
Price-to-Sales Ratio (P/S)
P/S = Market Capitalization ÷ Revenue
P/S can be useful when a company has little or no profit.
For example, a rapidly growing company may have:
- ₹1,000 crore revenue
- ₹2,000 crore market capitalization
- Minimal current profit
P/E cannot meaningfully value it if earnings are negative.
P/S can provide an initial reference point.
However, revenue alone doesn’t create shareholder value.
A company generating ₹1,000 crore in revenue with a 20% sustainable margin is economically very different from one generating the same revenue with permanently negative margins.
PEG Ratio
The PEG ratio incorporates earnings growth into the P/E framework.
A simplified formula is:
PEG = P/E ÷ Expected Earnings Growth Rate
For example:
- P/E = 30
- Expected earnings growth = 20%
PEG = 30 ÷ 20 = 1.5
PEG can be useful as a screening tool, but it has an important weakness: growth estimates can be highly uncertain.
A low PEG does not automatically mean a stock is undervalued.
EV/EBITDA
Enterprise Value (EV) considers the value of the operating business after accounting for debt and cash.
A simplified concept is:
EV ≈ Market Capitalization + Debt − Cash
EV/EBITDA then compares that enterprise value with EBITDA.
This can be useful when comparing companies with different capital structures.
For example, consider two companies with identical operating businesses:
- Company A has almost no debt.
- Company B has substantial debt.
Their P/E ratios may not tell the entire story.
EV/EBITDA can provide an additional perspective.
Free Cash Flow Yield
A simplified version is:
FCF Yield = Free Cash Flow ÷ Market Capitalization
If a company generates ₹100 crore in free cash flow and has a market capitalization of ₹1,000 crore:
FCF Yield = 10%
This metric can be particularly useful for mature cash-generating businesses.
But again, you need to ask whether the current level of free cash flow is sustainable.
How to Value a Stock Using Discounted Cash Flow (DCF)
DCF is one of the most important intrinsic valuation methods.
The fundamental idea is simple:
A business is worth the present value of the cash it can generate in the future.
DCF is widely used in professional valuation and involves forecasting future cash flows and discounting them back to today’s value.
The mathematics can become complicated, but the underlying concept is straightforward.
Step 1: Estimate future free cash flow
Start with historical financial performance.
Then estimate future:
- Revenue
- Operating margins
- Taxes
- Capital expenditure
- Working capital requirements
From these assumptions, estimate future free cash flow.
The biggest mistake is simply extrapolating historical growth indefinitely.
A company that grew 30% for five years does not necessarily deserve a 30% growth assumption for the next ten years.
Step 2: Estimate the growth rate
Consider:
- Industry growth
- Market size
- Competitive position
- Pricing power
- Reinvestment opportunities
- Historical performance
- Management strategy
Growth requires resources.
A company cannot necessarily grow rapidly forever without investing additional capital.
Step 3: Choose a discount rate
Future money is worth less than money today because money available today can potentially be invested and because future cash flows carry uncertainty.
The discount rate reflects this time value and required return.
For enterprise-level DCF models, analysts commonly use WACC—the weighted average cost of capital—as the discount rate.
A higher discount rate generally produces a lower valuation.
A lower discount rate generally produces a higher valuation.
This is one reason DCF outputs can change substantially when assumptions change.
Step 4: Calculate the present value of future cash flows
Conceptually:
Present Value = Future Cash Flow ÷ (1 + Discount Rate)^Number of Years
For example, if you expect ₹121 five years from now and use a 10% discount rate:
Present Value = ₹121 ÷ (1.10)^5
The resulting present value is approximately ₹75.
The farther a cash flow is into the future, the more heavily it is discounted.
Step 5: Calculate terminal value
It is difficult to forecast a business year by year forever.
Therefore, DCF models commonly forecast a finite period and then estimate the value of the business beyond that period through a terminal value.
Two common approaches are:
- Perpetual growth method
- Exit multiple method
The terminal value can represent a large portion of a DCF valuation, which is why terminal assumptions deserve careful scrutiny.
Step 6: Convert enterprise value into equity value
If you calculate enterprise value, you need to reconcile it with the value attributable to shareholders.
A simplified framework is:
Enterprise Value − Debt + Cash = Equity Value
Then:
Equity Value ÷ Shares Outstanding = Estimated Value Per Share
The distinction between enterprise value and equity value is essential when using DCF and enterprise-based multiples.
Why DCF Can Be Powerful
DCF forces you to explicitly answer important questions:
How quickly will the company grow?
What margins can it achieve?
How much cash will it generate?
How much capital will it need?
How risky are those future cash flows?
That makes DCF more than a calculator.
It is a framework for thinking about a business.
Why DCF Can Create False Precision
Suppose your DCF says:
Intrinsic value = ₹683 per share
It may look extremely precise.
But what happens if:
- Revenue growth is 12% instead of 15%?
- Margins are 18% instead of 21%?
- Discount rate is 11% instead of 10%?
- Terminal growth is 4% instead of 5%?
The valuation could change dramatically.
Therefore, don’t confuse mathematical precision with analytical certainty.
A model can calculate ₹683.42 perfectly while the underlying assumptions are completely wrong.
Dividend Discount Model: When Does It Make Sense?
The Dividend Discount Model (DDM) values a stock based on the present value of expected future dividends.
The basic idea is:
The value of a share equals the present value of the dividends expected to be received in the future.
DDM can be particularly appropriate for mature companies with relatively predictable dividend policies.
Gordon Growth Model
A simplified version of the Gordon Growth Model is:
Value = D₁ ÷ (r − g)
Where:
- D₁ = expected dividend next year
- r = required rate of return
- g = long-term dividend growth rate
The model is highly sensitive to its assumptions.
If the required return and growth rate are very close, small changes can create very large valuation differences.
When does DDM work best?
DDM tends to be more useful for companies with:
- Predictable dividends
- Mature operations
- Sustainable payout ratios
- Relatively stable earnings
It is less useful for companies that don’t pay dividends or whose dividend policy changes significantly.
How to Choose the Right Valuation Method
There is no universal valuation formula.
Different businesses require different approaches.
| Company type | Potentially useful methods |
|---|---|
| Mature profitable company | P/E + DCF |
| High-growth company | DCF + P/S + EV-based metrics |
| Asset-heavy company | P/B + P/E |
| Bank | P/B + P/E |
| Dividend-focused company | DDM + P/E |
| Capital-intensive company | EV/EBITDA + DCF |
| Loss-making growth company | P/S + EV-based metrics |
| Cyclical company | Normalized earnings + EV/EBITDA |
These aren’t strict rules.
They are starting points.
The best valuation method is the one that matches the economic characteristics of the business.
How to Value a Stock Step by Step
Now let’s put everything together into a repeatable process.
Step 1: Understand the business
Before looking at valuation, understand how the company makes money.
If you cannot explain the business in simple language, you’re probably not ready to value it.
Step 2: Analyze historical financials
Look at several years of:
- Revenue
- EPS
- Margins
- Cash flow
- Debt
- Returns on capital
Look for trends rather than isolated numbers.
Step 3: Assess profitability and cash generation
Ask:
Are earnings growing?
Are margins sustainable?
Is operating cash flow strong?
Is free cash flow positive?
Are profits converting into cash?
Step 4: Examine debt and financial risk
Debt can magnify both good and bad outcomes.
A highly leveraged business deserves a different analysis from a company with a net cash balance.
Step 5: Compare valuation multiples with appropriate peers
Compare:
- P/E
- EV/EBITDA
- P/B
- P/S
- FCF yield
But make sure the companies are genuinely comparable.
A software company and a commodity producer should not automatically be compared using the same multiple.
Step 6: Estimate intrinsic value
Depending on the company, use:
- P/E
- DCF
- DDM
- P/B
- EV/EBITDA
- Other appropriate approaches
Ideally, use more than one method as a cross-check.
Step 7: Run multiple scenarios
Build:
Bear case
Base case
Bull case
For example:
| Scenario | Growth | Margin | Estimated value |
|---|---|---|---|
| Bear | 8% | 17% | ₹420 |
| Base | 12% | 20% | ₹600 |
| Bull | 16% | 22% | ₹780 |
These figures are purely illustrative.
The point is to demonstrate that valuation should be viewed as a range of possible outcomes.
Step 8: Compare estimated value with market price
Suppose the stock trades at ₹450 and your scenarios produce:
- Bear: ₹420
- Base: ₹600
- Bull: ₹780
The stock isn’t simply “worth ₹600.”
Instead, you’ve identified a range of outcomes and can investigate what assumptions drive each one.
Step 9: Apply a margin of safety
If your estimated intrinsic value is ₹600, you shouldn’t automatically conclude that ₹590 is an attractive purchase.
Your estimate could be wrong.
A margin of safety provides room for estimation errors.
Step 10: Write down your investment thesis
Document:
What do I believe?
Why might the market be wrong?
What assumptions support my valuation?
What could prove me wrong?
Which financial metrics will tell me whether the thesis is working?
This turns valuation into a process that can be tested rather than a number that you defend emotionally.
How to Calculate a Stock’s Intrinsic Value
There are several common approaches.
Earnings-based valuation
Estimated Value = EPS × Appropriate P/E
Example:
EPS = ₹20
Appropriate P/E = 18
Estimated value:
₹20 × 18 = ₹360
DCF valuation
Estimate future free cash flows, discount them to present value and add the estimated terminal value.
Then reconcile enterprise value with cash and debt and divide the resulting equity value by shares outstanding.
Dividend-based valuation
Estimate future dividends and discount them back to today’s value.
This is most relevant when dividends are reasonably predictable.
How to Tell Whether a Stock Is Undervalued or Overvalued
Don’t rely on one ratio.
Use several layers of analysis.
Compare estimated intrinsic value with market price
If your reasonable valuation range is significantly above the market price, the stock may warrant further investigation.
Compare valuation multiples with peers
If a company trades at a premium to competitors, determine why.
Perhaps it has:
- Better margins
- Higher growth
- Higher ROIC
- Lower debt
- Stronger competitive advantages
If you can’t identify a reason for the premium, further investigation is warranted.
Compare valuation with historical levels
A company trading at a P/E of 25 might look expensive until you discover that it historically traded between 30 and 40 while maintaining similar fundamentals.
Historical valuation can provide context, but it isn’t automatically a fair-value benchmark.
Ask whether the discount is justified
This is perhaps the most important question.
A stock trading at 8× earnings might be cheap.
Or it might deserve 8× earnings because the business is deteriorating.
A low valuation is often low for a reason.
The Most Important Concept: Margin of Safety
Margin of safety is the gap between your estimated value and the price you pay.
A commonly used formula is:
Margin of Safety = (Intrinsic Value − Market Price) ÷ Intrinsic Value × 100
Suppose:
- Estimated intrinsic value = ₹1,000
- Market price = ₹700
Then:
Margin of Safety = (₹1,000 − ₹700) ÷ ₹1,000 × 100 = 30%
This does not mean the investment has a guaranteed 30% upside.
It means your estimated value is 30% above the current price under the assumptions used.
Why margin of safety matters
Valuation models contain uncertainty.
Your assumptions about:
- Growth
- Margins
- Interest rates
- Competition
- Capital expenditure
- Future cash flows
can all be wrong.
A margin of safety attempts to reduce the consequences of being wrong.
Why there is no universal margin-of-safety percentage
A stable company with predictable cash flows may have less valuation uncertainty than a rapidly changing business.
Therefore, simply saying “always demand a 30% margin of safety” is too simplistic.
The appropriate cushion depends on the quality and uncertainty of the underlying business and your valuation assumptions.
Why a Cheap Stock Can Still Be a Bad Investment
One of the biggest mistakes beginners make is assuming:
Low P/E = Cheap = Good investment
That chain of reasoning is incomplete.
The value trap
A value trap is a stock that appears cheap based on conventional valuation metrics but continues to decline because the underlying business is deteriorating.
Imagine a company earning ₹20 per share and trading at ₹200.
Its P/E is 10.
You might think it is cheap.
But what if earnings fall to ₹10?
The stock now trades at:
₹200 ÷ ₹10 = 20× earnings
What looked cheap was actually priced against earnings that were temporarily inflated.
Declining businesses can look cheap
If revenue, margins and cash flow are falling, a low valuation multiple may be completely justified.
Low P/E can reflect falling future earnings
Markets price stocks based largely on expectations about the future.
If investors expect earnings to decline sharply, the stock may trade at a low multiple today.
High debt can destroy equity value
Debt creates obligations that must be paid before equity holders receive residual value.
Therefore, a company with substantial debt requires additional analysis beyond P/E.
Cyclical earnings can make stocks appear artificially cheap
Commodity, shipping, chemical and other cyclical businesses can experience exceptionally high earnings during favorable periods.
Their P/E can become unusually low precisely when earnings are near a cyclical peak.
That is why normalized earnings are often more useful for cyclical companies.
Advanced Stock Valuation: What Serious Investors Should Examine
Once you understand basic valuation, several additional concepts become important.
Normalized earnings
Suppose a company normally earns ₹100 crore but temporarily earns ₹200 crore because of an unusual event.
Using ₹200 crore as your permanent earnings base could make the stock appear artificially cheap.
Normalization attempts to estimate what earnings might look like under more typical conditions.
Earnings quality
Two companies can report identical profits but have very different cash-flow characteristics.
Compare:
Net income
with
Operating cash flow
and
Free cash flow
Large and persistent differences deserve investigation.
Return on invested capital
Growth isn’t automatically valuable.
A company can grow revenue while destroying capital.
A business that consistently earns high returns on the capital required to operate and grow may have better economics than one that needs enormous investment to generate modest returns.
Competitive advantage
A company’s competitive advantage can affect how long it can maintain:
- High margins
- High returns on capital
- Pricing power
- Customer retention
- Market share
Those factors ultimately influence future cash flows and therefore valuation.
Reinvestment requirements
Growth requires investment.
If a company must spend almost all of its operating cash flow to maintain and expand its business, its economic value can differ significantly from a company that generates substantial excess cash.
Share dilution and stock-based compensation
This is frequently overlooked by beginners.
Suppose a company’s total equity value increases, but the number of shares outstanding also increases substantially.
The value attributable to each existing share may not rise proportionately.
Therefore, always pay attention to shares outstanding.
Buybacks
Share repurchases can increase value per share when a company buys shares at attractive prices.
But buying back expensive shares can destroy shareholder value.
A buyback should therefore be evaluated in the context of the company’s valuation and capital allocation decisions.
Reverse DCF: What Does the Current Stock Price Assume?
Most valuation models ask:
“What is this business worth?”
Reverse DCF asks:
“What does the current stock price assume this business will achieve?”
This is an extremely useful way to think about expensive stocks.
Suppose a stock trades at a very high valuation.
Instead of immediately concluding that it is overvalued, ask:
What growth rate would justify this price?
Maybe the current price implicitly assumes:
- 20% revenue growth for ten years
- Sustained 25% margins
- Low capital requirements
- Strong competitive advantages
Now ask whether those assumptions are realistic.
Reverse valuation therefore shifts the analysis from:
“The P/E is high.”
to:
“The market expects extraordinary future economics. Are those expectations achievable?”
Reverse DCF is specifically used to work backward from the current valuation and estimate the future cash flows required to support it.
Sensitivity Analysis: How Reliable Is Your Valuation?
A valuation model should not end with a single number.
Test what happens when assumptions change.
Change the growth rate
What happens if long-term growth is 8% rather than 12%?
Change the discount rate
What happens if your discount rate rises from 10% to 11%?
Change the terminal growth rate
What happens if terminal growth is 3% rather than 5%?
These changes can have a significant effect on DCF valuation.
That’s why analysts often use sensitivity analysis and valuation ranges rather than presenting one supposedly exact intrinsic value. (Wikipedia)
A good valuation question is therefore not:
“What is the exact fair value?”
It is:
“Across reasonable assumptions, what range of values do I get, and which assumptions matter most?”
How to Value Different Types of Companies
How to value a bank
Banks are different from ordinary industrial companies because debt and financial assets are fundamental components of their business model.
Useful metrics can include:
- P/B
- P/E
- ROE
- Asset quality
- Capital adequacy
- Net interest margins
For banks, book value and returns on equity can be particularly important.
How to value an insurance company
Consider:
- Book value
- Profitability
- Underwriting performance
- Investment income
- Premium growth
- Capital requirements
A simple P/E comparison may not capture the economics of an insurer.
How to value a technology company
Depending on its stage, consider:
- Revenue growth
- Gross margins
- Operating margins
- Free cash flow
- P/E
- EV/EBITDA
- P/S
For high-growth technology companies, current earnings may not fully capture the economics of the business.
How to value a cyclical company
Use normalized earnings rather than blindly using peak or trough earnings.
Look across the cycle.
Ask:
What does this business earn under normal conditions?
That can produce a more useful valuation than simply applying today’s P/E.
How to value a loss-making growth company
P/E doesn’t work if earnings are negative.
Possible areas of analysis include:
- P/S
- EV/revenue
- Gross margins
- Customer economics
- Cash burn
- Path to profitability
- Capital requirements
The challenge is determining whether today’s losses are investments in future economics or evidence of a fundamentally weak business.
How to value a dividend stock
Consider:
- Dividend yield
- P/E
- Dividend growth
- Payout ratio
- Free cash flow
- Dividend sustainability
DDM may also be appropriate when future dividends are reasonably predictable.
Common Stock Valuation Mistakes to Avoid
Using only one valuation metric
P/E alone rarely tells the complete story.
Use multiple perspectives.
Assuming a low P/E means undervaluation
A low P/E could reflect deteriorating fundamentals.
Always ask why the multiple is low.
Using unrealistic growth assumptions
A company cannot maintain extraordinary growth forever simply because it achieved it historically.
Growth tends to become harder as a company becomes larger.
Ignoring debt
Two companies with identical profits can have very different risk profiles if their debt levels differ dramatically.
Ignoring cash flow
Accounting earnings can sometimes give an incomplete picture of economic performance.
Comparing unrelated companies
A P/E comparison between fundamentally different businesses may be meaningless.
Peer selection matters.
Using stale information
Valuation should use reasonably current financial information.
A model based on outdated earnings, debt or share counts can produce misleading results.
Treating analyst estimates as facts
Analyst forecasts are estimates.
They can be useful inputs but should not be treated as guaranteed future results.
Confusing a low stock price with cheap valuation
A ₹50 stock isn’t necessarily cheaper than a ₹5,000 stock.
Share price alone tells you almost nothing about valuation.
What matters is the relationship between price and the company’s financial and economic characteristics.
Creating false precision with DCF
If your assumptions are uncertain, reporting an intrinsic value of ₹723.48 does not make the valuation more accurate.
Use ranges and scenarios.
Ignoring dilution
If the share count keeps increasing, your ownership percentage and per-share economics can be affected.
Valuing the company without understanding the business
This is perhaps the biggest mistake.
Valuation is not a substitute for business analysis.
A Practical Stock Valuation Checklist
Before considering your valuation complete, ask:
Business: Do I understand how the company makes money?
Financials: Are revenue, earnings and margins healthy?
Cash flow: Does accounting profit translate into cash?
Balance sheet: Is debt manageable?
Growth: What realistically drives future growth?
Profitability: Are returns on capital attractive and sustainable?
Valuation: Which multiples are appropriate for this business?
Intrinsic value: What does my DCF or other fundamental model suggest?
Expectations: What future performance is already reflected in today’s stock price?
Risk: What could make my valuation wrong?
Margin of safety: Is there enough room for estimation error?
Thesis: What evidence would prove my assumptions wrong?
That final question is particularly important.
Good analysis isn’t about proving that you are right.
It’s about identifying what would prove you wrong.
Stock Valuation Example: Putting Everything Together
Let’s use a fictional company called ABC Industries.
Assume:
- Current share price = ₹450
- EPS = ₹25
- Free cash flow per share = ₹20
- Revenue growth = 12%
- Moderate debt
- Stable margins
Step 1: P/E valuation
Current P/E:
₹450 ÷ ₹25 = 18×
Suppose comparable companies with similar characteristics trade around 20×.
A simple earnings-based estimate would be:
₹25 × 20 = ₹500
That suggests ₹500 under this particular assumption.
But that’s only one method.
Step 2: DCF valuation
Suppose your DCF produces:
₹560 per share
But your sensitivity analysis produces:
- Bear case = ₹410
- Base case = ₹560
- Bull case = ₹720
Now you have a much more informative picture.
Step 3: Compare with market price
Current price = ₹450.
Your valuation range is:
₹410–₹720
The current price is below the base-case estimate but above the bear-case estimate.
That doesn’t automatically mean “buy.”
Instead, investigate:
Why is the market assigning ₹450?
Maybe investors believe growth will slow.
Maybe margins will fall.
Maybe the industry is becoming more competitive.
Maybe the market is simply more conservative about the company’s future.
Step 4: Test the thesis
Suppose your valuation assumes 12% annual growth.
What happens if growth is only 7%?
If the investment thesis collapses under a modestly lower growth assumption, your valuation may be too dependent on optimistic assumptions.
This is the type of thinking that makes valuation useful.
Stock Valuation Tools and Data Sources
A valuation model is only as good as the information going into it.
For companies listed in India, investors can use primary sources such as:
- Company annual reports
- Quarterly financial results
- Investor presentations
- Stock exchange filings
- Audited financial statements
- Regulatory disclosures
Third-party financial websites and screeners can be excellent for quickly finding ratios and historical data.
But when an important number materially affects your valuation, it is good practice to verify it against the company’s filings or other primary sources.
This is especially important for:
- Debt
- Cash
- Shares outstanding
- Free cash flow
- Exceptional items
- Promoter/shareholding information
- Acquisitions
- Related-party transactions
Is Stock Valuation Enough to Make an Investment Decision?
No.
Valuation is an important part of investment analysis, but it is not the entire process.
A company can look undervalued based on a spreadsheet and still perform poorly because:
- The business deteriorates.
- Competition increases.
- Management makes poor decisions.
- Debt becomes excessive.
- Regulation changes.
- Industry economics deteriorate.
- Your growth assumptions prove unrealistic.
Similarly, a company can appear expensive and continue to perform well if its future growth and profitability exceed what the market previously expected.
Therefore, a complete investment analysis should consider:
Business quality + financial strength + competitive position + management/capital allocation + valuation + risk
Frequently Asked Questions About Stock Valuation
What is the easiest way to value a stock?
For a beginner, P/E-based relative valuation is one of the easiest starting points. You divide the share price by EPS and compare the resulting multiple with appropriate peers and the company’s own history. However, P/E should not be used alone because it can be misleading when earnings are volatile, negative or distorted by unusual items. (Corporate Finance Institute)
How do you calculate the fair value of a stock?
There is no single universal formula. Common approaches include applying an appropriate P/E multiple to normalized EPS, using a DCF model to discount future cash flows, using comparable-company multiples, or applying a dividend discount model to suitable dividend-paying companies.
What is a good P/E ratio for a stock?
There is no universally good P/E ratio. The appropriate multiple depends on growth, profitability, business quality, financial risk, industry characteristics and expected future earnings.
What is the difference between intrinsic value and market price?
Market price is the price investors currently pay for the shares. Intrinsic value is an estimate of what the underlying business may be worth based on its future economic performance.
What is the best stock valuation method?
There is no single best method for every company. DCF can be useful for businesses with reasonably forecastable cash flows, while relative multiples such as P/E or EV/EBITDA can provide useful market-based comparisons. (Corporate Finance Institute)
Is DCF the best way to value a stock?
DCF is a powerful valuation framework, but it is not automatically the best method for every company. Its results depend heavily on assumptions about future cash flows, discount rates and terminal value.
How do I know if a stock is undervalued?
Estimate a reasonable valuation range using appropriate methods, compare it with the current market price, examine peer and historical multiples, and determine whether the difference is justified by the company’s risks and future prospects.
What is the difference between P/E and PEG?
P/E compares a company’s share price with its earnings. PEG incorporates an earnings-growth estimate into the P/E framework. PEG can therefore provide additional context, but its usefulness depends heavily on the reliability of the growth forecast.
Can you value a stock without using DCF?
Yes. P/E, P/B, P/S, EV/EBITDA, free cash flow yield, DDM and comparable-company analysis can all be useful depending on the business.
Why can a stock with a low P/E still fall?
Because the company’s future earnings may decline. A low P/E based on today’s earnings can become much less attractive if those earnings are unsustainable.
How often should you revalue a stock?
You generally don’t need to completely rebuild a valuation every time the share price moves.
Revisit the valuation when material information changes, such as:
Earnings
Growth expectations
Debt
Margins
Capital expenditure
Competitive conditions
Management strategy
The goal is to respond to changes in business fundamentals, not every short-term price movement.
Conclusion: Learn to Value Businesses, Not Just Stock Prices
Learning how to value a stock isn’t about discovering a magical formula that tells you exactly what a share should be worth.
It is about developing a disciplined way to think.
Start by understanding the business.
Then examine its financial statements, profitability, cash generation, balance sheet and competitive position.
Next, choose valuation methods that make sense for that particular business. P/E can be a useful starting point for profitable companies. EV/EBITDA can help when capital structures differ. P/B can be relevant for certain financial and asset-heavy businesses. DDM can be useful for predictable dividend payers. DCF can provide a deeper intrinsic valuation when future cash flows can be reasonably estimated.
But don’t stop at a single number.
Build bear, base and bull cases. Test your assumptions. Consider what the current stock price already expects. Use reverse valuation when appropriate. Most importantly, understand your margin of safety and identify what could make your analysis wrong.
The ultimate objective isn’t to predict tomorrow’s stock price.
It’s to answer a much more useful question:
“Am I paying a reasonable price for the future economics of this business, given what I know and what I don’t know?”
No valuation model can predict a stock’s future price with certainty. Every valuation depends on assumptions about growth, profitability, competition, interest rates, capital requirements and risk.
Use valuation as a framework for disciplined analysis—not as a promise of returns or a substitute for independent financial judgment.
If you consistently learn to analyze business quality, financial performance, future cash flows, valuation and risk together, you’ll develop a much stronger foundation for making informed investment decisions.
Related Posts:
- Financial Ratios Explained: PE, PB, ROE & How to Analyze Any Stock
- Price to Sales Ratio (P/S): Formula, Meaning & Calculation
- What Is the Price-to-Book Ratio? Formula, Meaning & Examples
- P/E Ratio: Meaning, Formula, Examples & How to Analyze It
- What Is EBITDA? Meaning, Formula, Calculation & Examples
- P/E Ratio vs EV/EBITDA: Differences, Formulas & Examples
- What Is the PEG Ratio? Formula, Calculation, Meaning, and How to Use It
- What Is EPS? Earnings Per Share Explained With Formula, Examples & How to Analyze It

You may also like

Price to Sales Ratio (P/S): Formula, Meaning & Calculation
What Is the Price-to-Book Ratio? Formula, Meaning & Examples