P/E Ratio: Meaning, Formula, Examples & How to Analyze It
Learn what the P/E ratio means, how to calculate it, what high and low P/E ratios indicate, and how to use P/E to analyze stocks with examples.
The Price-to-Earnings (P/E) ratio is one of the most widely used stock valuation metrics. It helps investors compare a company’s share price with its earnings and understand how much the market is paying for each rupee or dollar of profit.
However, a P/E ratio should not be interpreted in isolation. A low P/E does not automatically mean a stock is cheap, and a high P/E does not automatically mean it is expensive. Industry, earnings growth, profitability, debt, cash flow, business quality, and investor expectations all influence what a P/E ratio means.
In this guide, you will learn what the P/E ratio means, how to calculate it, what high and low P/E ratios indicate, how trailing and forward P/E differ, how to compare P/E ratios across companies, and the major mistakes investors should avoid.
Table of Contents
What Is the P/E Ratio?
The Price-to-Earnings (P/E) ratio measures a company’s share price relative to its earnings per share (EPS).
P/E Ratio Formula
P/E Ratio = Current Market Price per Share ÷ Earnings Per Share (EPS)
For example, suppose a company’s share price is ₹500, and its earnings per share are ₹25.
P/E = ₹500 ÷ ₹25 = 20
The company therefore has a P/E ratio of 20×.
In simple terms, investors are paying ₹20 for every ₹1 of the company’s annual earnings per share.
The same concept can be expressed at the company level:
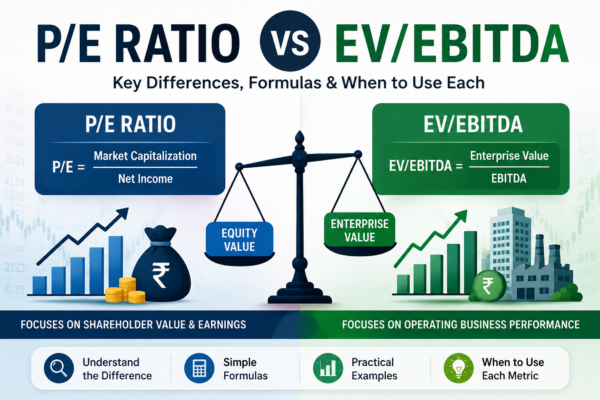
P/E = Market Capitalization ÷ Net Income
Both formulas describe the same basic relationship between the value investors place on a company and the earnings it generates.
What Does the P/E Ratio Actually Tell You?
The P/E ratio tells you how the market values a company’s current earnings.
For example, imagine two companies:
- Company A trades at 10× earnings.
- Company B trades at 30× earnings.
At first glance, Company A may appear cheaper. But that conclusion could be wrong.
Company A might have declining revenue, high debt, weak cash flow, and falling profits.
Company B might have strong earnings growth, high returns on capital, a strong balance sheet, and a durable competitive advantage.
Therefore, P/E is better understood as a valuation multiple, not a simple “cheap versus expensive” indicator.
A P/E ratio reflects not only current earnings but also what investors expect about the company’s future growth, profitability, risk, and earnings stability.
Why Is P/E Called a Multiple?
You will often see P/E written as:
- 10× P/E
- 15× P/E
- 20× P/E
- 30× P/E
The “×” means “times.”
If a company has a P/E of 20×, its market price is 20 times its annual earnings per share.
For example:
Share price = ₹400
EPS = ₹20
P/E = 20×
This does not mean an investor is guaranteed to recover their money in exactly 20 years. P/E is not a guaranteed payback period because earnings, share prices, growth, dividends, and valuation multiples can all change.
How to Calculate the P/E Ratio
The basic P/E calculation is straightforward.
Formula
P/E = Share Price ÷ EPS
Suppose:
- Current share price = ₹600
- EPS = ₹30
Then:
P/E = ₹600 ÷ ₹30 = 20×
The company’s P/E ratio is therefore 20.
What Is EPS?
Earnings Per Share (EPS) represents the portion of a company’s profit attributable to each share.
A simplified formula is:
EPS = Net Income attributable to common shareholders ÷ Number of shares
For example, if a company earns ₹100 crore and has 10 crore shares, its simplified EPS would be:
₹100 crore ÷ 10 crore = ₹10 EPS
If its share price is ₹200:
P/E = ₹200 ÷ ₹10 = 20×
Why the EPS Used Matters
Not all EPS figures are necessarily the same.
Financial websites may use:
- basic EPS
- diluted EPS
- trailing EPS
- adjusted EPS
- forecast EPS
As a result, two financial websites can sometimes display different P/E ratios for the same company.
Before comparing P/E ratios, it is important to understand which earnings figure is being used.
What Does a High P/E Ratio Mean?
A high P/E ratio means investors are paying a relatively high price compared with the company’s current earnings.
But a high P/E does not automatically mean the stock is overvalued.
A high P/E can occur because investors expect:
- strong future earnings growth
- improving profitability
- durable competitive advantages
- stable earnings
- lower perceived business risk
- significant future opportunities
It can also occur because investors have become excessively optimistic.
Therefore, a high P/E can represent either reasonable expectations or excessive valuation.
Example of a High P/E
Suppose Company A has:
- Share price = ₹1,000
- EPS = ₹25
- P/E = 40×
If analysts and investors expect earnings to grow rapidly over the next several years, a 40× P/E may have a different meaning than it would for a company whose earnings are stagnant.
The important question is not simply:
“Is 40× P/E high?”
A better question is:
“Are the company’s growth, profitability, quality, and future prospects sufficient to justify the valuation?”
What Does a Low P/E Ratio Mean?
A low P/E ratio means investors are paying relatively little for each unit of current earnings.
This can sometimes indicate undervaluation.
But a low P/E can also indicate problems.
For example, a company may have a low P/E because:
- earnings are expected to decline
- revenue growth is slowing
- the industry is experiencing difficulties
- debt is increasing
- earnings are temporarily inflated
- the business is highly cyclical
- investors perceive significant risks
- the company’s competitive position is weakening
This is why simply searching for companies with the lowest P/E ratios can be dangerous.
Why a Low P/E Stock Can Be Expensive
This is one of the most important concepts to understand about valuation.
Suppose a company trades at ₹100 and currently earns ₹20 per share.
Its P/E is:
₹100 ÷ ₹20 = 5×
That appears very cheap.
But suppose the company’s earnings subsequently fall from ₹20 to ₹5.
At the same ₹100 share price:
₹100 ÷ ₹5 = 20×
The stock that originally appeared to have a 5× P/E is now trading at 20× earnings.
This demonstrates an important principle:
A low P/E based on temporary or peak earnings does not necessarily represent a cheap valuation.
This is particularly important when analyzing cyclical industries.
Why a High P/E Stock Can Sometimes Be Reasonable
Now consider a company trading at:
50× P/E
That may initially appear extremely expensive.
But suppose its earnings are growing rapidly and consistently, its balance sheet is strong, its competitive position is improving, and analysts expect substantial future earnings growth.
The valuation still requires careful analysis, but the high multiple may reflect genuine expectations about future earnings.
The problem occurs when investors pay a high multiple but future growth fails to meet expectations.
When that happens, the stock can experience P/E compression.
What Is a Good P/E Ratio?
There is no universally good P/E ratio.
A P/E of 10× could be cheap for one company and expensive for another.
Likewise, a P/E of 30× could be expensive for one business but reasonable for another.
The appropriate P/E depends on factors such as:
- industry
- earnings growth
- profitability
- earnings stability
- business risk
- debt
- interest rates
- competitive advantages
- historical valuation
Instead of asking:
“Is a P/E below 20 good?”
ask:
“How does this company’s current P/E compare with its industry, its own historical valuation, its expected growth, and its business quality?”
That is a much more useful valuation question.
How to Judge Whether a P/E Ratio Is Reasonable
There are three particularly useful comparisons.
Compare the Company With Its Peers
If similar companies in the same industry trade at 20× earnings and one company trades at 10×, the difference deserves investigation.
But the companies must actually be comparable.
A high-growth technology company should not automatically be compared with a slow-growth commodity producer.
Compare the Company With Its Own History
A company’s historical P/E can provide useful context.
Suppose a company has traditionally traded between 15× and 25× earnings.
If its current P/E is 18×, that may be closer to its historical valuation range than a P/E of 40×.
Historical comparisons should still account for changes in the company’s business, growth rate, profitability, and industry conditions.
Compare P/E With Earnings Growth
A higher P/E can sometimes be supported by stronger expected earnings growth.
But growth alone is not enough.
You should also consider whether the growth is:
- sustainable
- profitable
- supported by cash flow
- generated organically
- dependent on excessive debt
Trailing P/E vs Forward P/E
Two common forms of the P/E ratio are trailing P/E and forward P/E.
What Is Trailing P/E?
Trailing P/E uses historical earnings, usually earnings from the most recent 12 months, often called TTM (Trailing Twelve Months) earnings.
Formula
Trailing P/E = Current Share Price ÷ Trailing EPS
Because it uses reported historical earnings, trailing P/E is based on information that has already occurred.
However, historical earnings do not guarantee future earnings.
What Is Forward P/E?
Forward P/E uses estimated future earnings.
Formula
Forward P/E = Current Share Price ÷ Expected Future EPS
For example, if a company’s share price is ₹500 and analysts expect EPS of ₹25 over the next year:
Forward P/E = ₹500 ÷ ₹25 = 20×
Forward P/E can be useful because stock prices reflect expectations about the future.
However, the future EPS is an estimate.
If the company earns only ₹15 instead of the expected ₹25, the original forward P/E calculation becomes much less useful.
Trailing P/E vs Forward P/E: Which Is Better?
Neither is universally better.
Trailing P/E is based on actual historical earnings but may not reflect major changes that are occurring in the business.
Forward P/E incorporates expectations about future earnings but depends on the accuracy of forecasts.
A sensible analysis often considers both.
The important question is:
How reliable are the earnings assumptions behind the P/E ratio?
How to Use P/E Ratio to Analyze a Stock
P/E becomes much more useful when you use it as part of a structured process.
A practical framework is:
P/E → Peers → History → Growth → Earnings Quality → Debt → Cash Flow → Other Valuation Metrics
Let’s examine each step.
Step 1: Check the Current P/E
Start by identifying the company’s current P/E.
But don’t make a decision based on that number alone.
Step 2: Compare It With Industry Peers
Look at companies operating in the same or similar industry.
Ask:
- Why does this company trade at a higher multiple?
- Why does another company trade at a lower multiple?
- Are the earnings growth rates different?
- Are profitability and balance sheets different?
The difference in valuation can sometimes reveal important information.
Step 3: Check the Historical P/E
Look at how the company’s valuation has changed over time.
A company trading at a historically high multiple deserves closer examination.
Likewise, a company trading below its historical range may deserve investigation—but it is important to determine why the multiple has fallen.
Step 4: Examine Earnings Growth
A P/E multiple without an understanding of earnings growth is incomplete.
Suppose:
Company A: 10× P/E, 2% expected earnings growth
Company B: 25× P/E, 20% expected earnings growth
Company A has the lower P/E, but that does not automatically make it more attractive.
The growth expectations need to be evaluated carefully.
Step 5: Examine Earnings Quality
Ask whether the reported earnings are sustainable.
A company’s EPS can be temporarily boosted by:
- asset sales
- exceptional gains
- tax benefits
- accounting changes
- one-time income
If those earnings are unlikely to repeat, the P/E may give a misleading impression.
Step 6: Check Debt
P/E does not directly tell you how much debt a company carries.
Two companies can have identical P/E ratios but very different financial risk.
Therefore, debt and balance-sheet strength should be examined separately.
Step 7: Check Cash Flow
Profit and cash flow are not always identical.
A company can report accounting profits while generating weak operating cash flow.
That does not automatically mean the company is problematic, but it is a reason to investigate further.
Step 8: Use Other Valuation Metrics
P/E should be combined with appropriate metrics such as:
- P/B
- EV/EBITDA
- Price-to-Sales
- earnings yield
- free cash flow measures
The appropriate metric depends on the business.
P/E Ratio by Industry
Different industries often trade at different P/E ratios.
There is no single valuation multiple that works equally well across every sector.
Why Do Different Industries Have Different P/E Ratios?
Important factors include:
- growth rates
- profit margins
- capital requirements
- earnings stability
- competitive advantages
- regulation
- cyclicality
- financial risk
A business with predictable earnings may receive a different valuation from a company whose profits fluctuate dramatically with commodity prices.
P/E Ratio for Banks and Financial Companies
P/E can be useful for banks and financial companies, but it should not be used alone.
Investors often examine P/E alongside metrics such as:
- Price-to-Book (P/B)
- Return on Equity (ROE)
- asset quality
- capital adequacy
- net interest margins
- loan growth
- provisions
This is particularly relevant when analyzing Indian banks and financial institutions.
A bank’s balance sheet and asset quality can materially influence the quality of its earnings.
P/E Ratio for Technology Companies
Technology companies can sometimes trade at relatively high P/E ratios because investors expect strong future growth.
However, a high P/E should still be examined carefully.
Consider:
- revenue growth
- operating margins
- recurring revenue
- cash generation
- competitive position
- customer concentration
- future growth expectations
A high-growth company can justify a higher valuation than a mature company—but only if the underlying business performance supports those expectations.
P/E Ratio for Consumer and FMCG Companies
Consumer businesses with strong brands, stable demand and predictable earnings can sometimes command higher valuation multiples.
However, investors should still examine:
- revenue growth
- margins
- market share
- competitive advantages
- input costs
- cash flow
- valuation history
A high-quality business can still be overpriced if investors pay too much for it.
P/E Ratio for Cyclical Companies
P/E can be particularly misleading for cyclical businesses.
Cyclical companies can experience large changes in earnings depending on economic conditions, commodity prices, demand, or supply.
At the top of a cycle, earnings may be unusually high.
That can make the P/E look unusually low.
At the bottom of a cycle, earnings may be unusually low.
That can make the P/E look unusually high.
Therefore:
A low P/E does not necessarily mean a cyclical company is cheap, and a high P/E does not necessarily mean it is expensive.
The earnings cycle needs to be understood first.
P/E Ratio and Earnings Quality
One of the biggest weaknesses of a simple P/E analysis is that it treats EPS as if all earnings are equally valuable.
They are not.
Consider two companies that both report EPS of ₹20.
Company A generates ₹20 EPS primarily from its normal business operations.
Company B generates ₹20 EPS because it sold a property and recorded a large one-time gain.
Both companies have the same EPS, but the sustainability of their earnings may be very different.
This is why serious valuation analysis examines earnings quality.
Sustainable Earnings vs One-Time Profit
When reviewing financial statements, look for unusual items such as:
- asset-sale gains
- exceptional income
- large tax benefits
- restructuring charges
- unusual provisions
- discontinued operations
A one-time gain may increase reported EPS without increasing the company’s long-term earning power.
How Share Dilution Can Affect EPS
EPS can also change when the number of shares outstanding changes.
If a company issues new shares, earnings may be spread across a larger number of shares.
This is another reason to understand whether the P/E calculation uses basic or diluted EPS.
Why Cash Flow Matters
Operating cash flow can provide an additional perspective on the quality of reported earnings.
The relationship between:
Net income → operating cash flow → free cash flow
can help investors understand whether accounting profits are translating into cash generation.
P/E Ratio and Business Growth
Growth is one of the most important factors influencing valuation.
Investors are generally willing to pay more for a company when they expect its earnings to grow substantially in the future.
However, the critical issue is how much growth is already reflected in the share price.
Suppose investors expect a company to grow earnings by 25% annually.
If the company subsequently grows only 8%, investors may reassess the valuation.
The share price could fall even if the company remains profitable.
This is one reason why a high-quality company can still produce disappointing investment returns when purchased at an excessively high valuation.
What Is P/E Expansion and P/E Contraction?
P/E expansion occurs when investors are willing to pay a higher multiple for the company’s earnings.
For example:
20× P/E → 30× P/E
If earnings remain unchanged, a higher multiple can support a higher share price.
P/E contraction is the opposite.
For example:
30× P/E → 20× P/E
Even if earnings continue growing, a lower valuation multiple can put downward pressure on the share price.
This leads to an important concept:
Stock returns can be influenced by both earnings growth and changes in the valuation multiple investors are willing to pay.
P/E Ratio and Interest Rates
Interest rates can influence how investors value future earnings and riskier assets.
When interest rates rise, investors may demand higher expected returns from investments.
This can contribute to pressure on valuation multiples, particularly for companies whose valuations depend heavily on expectations of earnings far into the future.
However, the relationship is not mechanical.
A company’s individual growth prospects, profitability, balance sheet and industry conditions also matter.
Therefore, P/E should be interpreted within the broader economic environment rather than viewed as an isolated number.
P/E Ratio vs Other Valuation Metrics
P/E is useful, but different valuation metrics answer different questions.
P/E vs P/B Ratio
P/E compares market price with earnings.
P/B compares market value with book value.
P/B can be particularly useful when analyzing financial businesses where the balance sheet is an important component of the business model.
P/E vs EV/EBITDA
P/E is calculated using earnings attributable to shareholders.
EV/EBITDA starts from enterprise value and EBITDA, making it useful for comparing businesses with different capital structures in appropriate circumstances.
However, EBITDA also has limitations and should not be treated as equivalent to cash flow.
P/E vs Price-to-Sales
Price-to-Sales compares a company’s market value with revenue.
It can sometimes be useful for companies with very low or negative earnings, where P/E cannot provide a meaningful comparison.
However, revenue alone does not tell you whether a company is profitable.
P/E vs Earnings Yield
Earnings yield is the inverse of P/E.
Formula
Earnings Yield = EPS ÷ Share Price
Or:
Earnings Yield = 1 ÷ P/E
For example:
P/E = 20×
Therefore:
Earnings Yield = 1 ÷ 20 = 5%
This provides another way to look at the same valuation relationship.
What Is a Negative P/E Ratio?
A negative P/E generally occurs when a company has negative earnings, meaning it is reporting a loss.
For example:
- Share price = ₹100
- EPS = -₹5
Mathematically:
P/E = ₹100 ÷ -₹5 = -20×
However, a negative P/E should not be interpreted like a normal positive P/E.
A P/E of 20× and a P/E of -20× do not represent equivalent valuation situations.
When a company has negative earnings, investors may need to consider other metrics, depending on the business, such as:
- Price-to-Sales
- Enterprise Value-to-Sales
- EV/EBITDA where appropriate
- cash-flow measures
Major Limitations of the P/E Ratio
P/E is useful, but it has several important limitations.
P/E Does Not Directly Measure Debt
Two companies can have identical P/E ratios but completely different debt levels.
Debt can materially affect financial risk.
P/E Can Be Distorted by One-Time Earnings
Temporary gains can increase EPS and make P/E appear artificially low.
P/E Is Difficult to Use With Loss-Making Companies
Negative earnings make conventional P/E interpretation unsuitable.
P/E Depends on Accounting Earnings
EPS is an accounting measure and can be influenced by accounting policies and adjustments.
P/E Does Not Predict Future Stock Prices
A low P/E does not guarantee that a stock will rise.
A high P/E does not guarantee that it will fall.
P/E Is Not Equally Useful Across All Industries
The appropriate valuation framework differs between banks, technology companies, manufacturers, commodity businesses, real estate companies and other industries.
P/E Can Be Misleading for Cyclical Businesses
Peak or trough earnings can make the multiple look unusually attractive or unattractive.
Common P/E Ratio Mistakes Investors Make
Mistake 1: Assuming Low P/E Means Cheap
A low multiple may reflect genuine business problems.
Mistake 2: Assuming High P/E Means Overvalued
A high multiple may reflect strong expected growth.
Mistake 3: Comparing Completely Different Industries
P/E comparisons are most meaningful between reasonably comparable businesses.
Mistake 4: Ignoring Earnings Growth
A valuation multiple must be considered alongside the expected trajectory of earnings.
Mistake 5: Trusting Forward P/E Without Examining Estimates
Forward P/E depends on forecast earnings, which can be wrong.
Mistake 6: Ignoring Debt
P/E alone does not reveal the company’s leverage.
Mistake 7: Ignoring Cash Flow
Accounting profit and cash generation can differ.
Mistake 8: Looking at Only One Year’s P/E
Historical valuation can provide useful context.
Mistake 9: Treating P/E as a Buy or Sell Signal
P/E is a valuation tool, not a standalone trading signal.
A Practical P/E Ratio Analysis Framework
A useful way to remember the process is:
P/E → Peers → History → Growth → Earnings Quality → Debt → Cash Flow → Other Metrics
Let’s apply this framework to a hypothetical company.
Suppose Company A has:
- Current P/E = 25×
- Industry average P/E = 30×
- Historical P/E range = 18×–28×
- Earnings growth = 18%
- Moderate debt
- Healthy operating cash flow
Looking only at the P/E, you might say:
“The company trades at 25× earnings.”
But the full analysis tells you much more.
It trades below the industry’s 30× multiple, but near the upper end of its own historical range.
Its earnings are growing, but you still need to determine whether that growth is sustainable.
Its balance sheet and cash flow appear healthy in this hypothetical example.
The conclusion should not automatically be “buy.”
Instead, the analysis has helped you understand what further questions need to be answered.
Example of a P/E Value Trap
Now consider Company B:
- P/E = 8×
- Earnings recently increased sharply
- Revenue growth is slowing
- Debt is increasing
- Operating cash flow is weakening
- The industry is approaching the end of a business cycle
The 8× P/E may look attractive.
But if the company’s earnings decline substantially, the P/E could rise even without the share price increasing.
This is an example of why investors should distinguish between:
Cheap price
and
Cheap valuation based on sustainable earnings.
They are not necessarily the same thing.
P/E Ratio in India
P/E is widely used by investors analyzing companies listed on Indian stock exchanges.
When analyzing an Indian company, investors may compare its P/E with:
- competitors
- industry averages
- its historical P/E
- broader market valuations
- expected earnings growth
For Indian investors, it is also important to examine the company’s annual reports, exchange disclosures and financial statements rather than relying entirely on third-party financial websites.
Different financial platforms may report different P/E ratios depending on:
- data date
- EPS calculation
- trailing period
- adjusted earnings
- diluted shares
Therefore, always understand the methodology behind the number.
What Does Nifty P/E Mean?
The Nifty P/E ratio is used as a broad valuation measure for the Nifty index.
It represents the relationship between the index’s market value and the earnings of its constituent companies under the relevant index methodology.
However, an index P/E should not be interpreted exactly like the P/E of an individual company.
An index contains businesses from different industries, with different growth rates, margins, balance sheets and valuation multiples.
Therefore, saying:
“The Nifty P/E is high, so every Indian stock is expensive”
would be an oversimplification.
Likewise:
“The Nifty P/E is low, so every stock is cheap”
would also be incorrect.
P/E Ratio: India vs International Markets
Investors sometimes compare valuation multiples across countries.
For example, they may compare the valuation of Indian equities with U.S. or European markets.
Such comparisons can be useful, but they require context.
Different markets have different:
- sector compositions
- economic growth rates
- interest rates
- profitability levels
- corporate structures
- investor expectations
- accounting practices
Therefore, a market trading at a higher average P/E is not automatically more expensive in an economic sense.
The underlying earnings and growth expectations must also be considered.
Advanced P/E Concept: Justified P/E
For serious learners, the concept of justified P/E provides a more theoretical way of thinking about valuation.
A company’s justified valuation multiple is influenced by factors including:
- expected growth
- required rate of return
- payout or retention of earnings
The underlying principle is simple:
The higher the sustainable growth and the lower the perceived risk, the greater the valuation multiple investors may potentially be willing to accept, all else being equal.
However, these relationships are theoretical and depend on assumptions. They should not be treated as a precise formula for predicting stock prices.
What Is the CAPE Ratio?
The Cyclically Adjusted Price-to-Earnings (CAPE) ratio is a valuation measure that uses a longer-term average of inflation-adjusted earnings rather than relying solely on one year’s earnings.
The objective is to reduce the effect of short-term earnings cycles.
CAPE is more commonly discussed in the context of broad equity markets rather than routine analysis of individual companies.
It is useful for understanding long-term market valuation, but it has its own assumptions and limitations.
How to Find a Company’s P/E Ratio
You can usually find a company’s P/E ratio through financial information platforms, stock exchange data, annual reports and investor-relations materials.
However, it is important to verify the underlying figures.
For a more reliable analysis, check:
- Current share price and date
- Latest reported EPS
- Whether EPS is basic or diluted
- Whether earnings are TTM or forecast
- Whether earnings have unusual one-time items
For important investment decisions, primary financial documents such as company filings and annual reports can provide more reliable context than relying on a single financial website.
Frequently Asked Questions About P/E Ratio
What is a good P/E ratio?
There is no universal good P/E ratio. A reasonable P/E depends on the company’s industry, growth, profitability, risk, earnings quality, historical valuation and broader market conditions.
What does a P/E ratio of 20 mean?
A P/E ratio of 20 means the company’s current share price is 20 times its earnings per share. For example, if EPS is ₹10 and the share price is ₹200, the P/E is 20×.
Is a high P/E ratio good or bad?
Neither automatically. A high P/E may reflect strong expected earnings growth or high-quality earnings, but it may also indicate excessive investor optimism and overvaluation.
Is a low P/E ratio always better?
No. A low P/E may indicate attractive valuation, but it can also reflect declining earnings, high risk, weak growth, cyclical peak earnings or other business problems.
What is the difference between trailing P/E and forward P/E?
Trailing P/E uses historical earnings, generally from the most recent 12 months. Forward P/E uses estimated future earnings. Trailing P/E is based on reported results, while forward P/E depends on forecasts.
What does a P/E ratio of 30 mean?
A P/E of 30 means investors are paying ₹30 for every ₹1 of annual earnings per share. It does not guarantee a 30-year payback period or a particular future return.
How is the P/E ratio calculated?
The basic formula is:
P/E = Current Share Price ÷ Earnings Per Share
For example, a ₹300 share with EPS of ₹15 has a P/E of 20×.
What is the difference between P/E and EPS?
EPS measures the earnings attributable to each share. P/E compares the market price of the share with those earnings.
Why do different industries have different P/E ratios?
Different industries have different growth rates, profitability, capital requirements, risk levels, competitive structures and earnings stability. Therefore, valuation multiples can differ substantially between sectors.
Can P/E be used for companies with losses?
Traditional P/E is generally not meaningful when a company has negative earnings because the denominator, EPS, is negative.
What is the relationship between P/E and earnings yield?
Earnings yield is the inverse of P/E.
Earnings Yield = 1 ÷ P/E
Therefore, a 20× P/E corresponds to a 5% earnings yield.
Is P/E ratio useful for banks?
Yes, but it should generally be considered alongside metrics such as P/B, ROE, asset quality, capital adequacy and other banking-specific measures.
Is P/E ratio enough to value a stock?
No. P/E is only one valuation metric. A complete analysis should consider earnings growth, earnings quality, debt, cash flow, profitability, industry conditions and other appropriate valuation measures.
P/E Ratio vs PEG Ratio: Is P/E Enough?
Investors sometimes use the PEG ratio, which incorporates earnings growth into the valuation analysis.
The basic concept is:
PEG Ratio = P/E Ratio ÷ Earnings Growth Rate
For example, a company with a P/E of 20 and an expected earnings growth rate of 10% would have a simplified PEG of 2.
However, PEG should not be treated as a universal rule that a particular number means “buy” or “sell.”
Growth forecasts can be inaccurate, and the calculation can ignore important factors such as:
- debt
- earnings quality
- cash flow
- competitive advantages
- cyclicality
- duration of growth
Therefore, PEG can complement P/E, but it does not eliminate the need for broader analysis.
P/E Ratio and Investment Risk
The P/E ratio can help investors understand valuation, but valuation analysis cannot eliminate investment risk.
A company can have:
- a low P/E and falling earnings
- a high P/E and disappointing growth
- strong earnings but weak cash flow
- attractive valuation but significant debt
- excellent business quality but excessive valuation
This is why valuation should be treated as a process rather than a single number.
The objective is not to find a magical P/E threshold.
The objective is to understand:
What am I paying?
What earnings am I receiving?
How sustainable are those earnings?
How quickly might they grow?
What risks could cause those expectations to change?
Conclusion: Use P/E as a Starting Point, Not a Verdict
The Price-to-Earnings (P/E) ratio is one of the most useful and widely recognized valuation metrics for analyzing stocks.
The basic formula is simple:
P/E = Share Price ÷ EPS
But interpreting the result requires much more than looking at one number.
A low P/E does not automatically mean a stock is undervalued. A high P/E does not automatically mean it is overvalued. The right interpretation depends on the company’s earnings growth, industry, profitability, balance sheet, cash flow, competitive position, earnings quality, historical valuation and broader economic environment.
A practical framework is:
P/E → Peers → History → Growth → Earnings Quality → Debt → Cash Flow → Other Metrics
For beginners, the most important lesson is to avoid using P/E as a simple buy-or-sell signal.
For intermediate investors, the next step is to understand how P/E changes with earnings expectations and valuation multiples.
For serious learners, the deeper question is how sustainable earnings, growth, risk and required returns interact to determine what a reasonable valuation might look like.
Ultimately, P/E is a starting point for asking better questions—not a crystal ball for predicting future stock prices.
This article is for educational purposes only. It does not constitute investment advice, a recommendation to buy or sell any security, or a guarantee of investment returns. Investors should conduct their own research and consider their financial circumstances and risk tolerance before making investment decisions.
Related Posts:
- Financial Ratios Explained: PE, PB, ROE & How to Analyze Any Stock
- Price to Sales Ratio (P/S): Formula, Meaning & Calculation
- What Is the Price-to-Book Ratio? Formula, Meaning & Examples
- What Is EBITDA? Meaning, Formula, Calculation & Examples
- P/E Ratio vs EV/EBITDA: Differences, Formulas & Examples
- What Is the PEG Ratio? Formula, Calculation, Meaning, and How to Use It
- What Is EPS? Earnings Per Share Explained With Formula, Examples & How to Analyze It
- How to Value a Stock: Complete Stock Valuation Guide

You may also like

Price to Sales Ratio (P/S): Formula, Meaning & Calculation

What Is the Price-to-Book Ratio? Formula, Meaning & Examples