What Is the PEG Ratio? Formula, Calculation, Meaning, and How to Use It
What Is the PEG Ratio? Formula, Calculation, Meaning, and How to Use It
When investors evaluate a stock, one of the first valuation metrics they often encounter is the P/E ratio (Price-to-Earnings ratio). But P/E has one important limitation: it tells you how much investors are paying for a company’s earnings, but it does not directly tell you how fast those earnings are expected to grow.
That’s where the PEG ratio comes in.
The PEG ratio, or Price/Earnings-to-Growth ratio, compares a company’s P/E ratio with its earnings growth rate. It is commonly used to evaluate whether a stock’s valuation appears reasonable relative to its expected earnings growth.
A commonly used formula is:
PEG Ratio = P/E Ratio ÷ Earnings Growth Rate
For example, if a company has a P/E ratio of 30 and expected earnings growth of 25%, its PEG ratio would be:
30 ÷ 25 = 1.20
However, a PEG ratio should never be treated as an automatic buy or sell signal. The result depends heavily on the quality of the growth estimate, the company’s profitability, balance sheet, cash flow, industry, and other fundamental factors.
In this guide, we’ll explain what the PEG ratio means, how to calculate it, what constitutes a “good” PEG ratio, how it differs from P/E, and—most importantly—when the PEG ratio can give you a misleading picture.
Table of Contents
What Is the PEG Ratio?
The PEG ratio is a stock valuation metric that compares a company’s price-to-earnings ratio with its earnings growth rate.
In simple terms:
P/E tells you how much you’re paying for earnings. PEG adds earnings growth to that valuation picture.
Suppose two companies have the following numbers:
- Company A: P/E of 30
- Company B: P/E of 15
At first glance, Company B appears cheaper.
But suppose Company A is expected to grow earnings by 30% annually, while Company B is expected to grow by only 8%.
The P/E ratios alone don’t tell the whole story.
PEG attempts to put valuation and growth into the same framework.
What Does PEG Stand For?
PEG stands for:
Price/Earnings-to-Growth
It combines three concepts:
- Price — what investors are paying for the stock
- Earnings — the company’s profits
- Growth — how quickly those earnings are increasing or expected to increase
The metric is particularly associated with growth-oriented investing and is often discussed in the context of GARP, or Growth at a Reasonable Price.
Why Was the PEG Ratio Developed?
The basic idea behind PEG is that companies with different growth rates may reasonably trade at different P/E multiples.
A fast-growing company may deserve a higher P/E than a slow-growing company.
PEG attempts to account for this difference instead of looking at P/E in isolation.
The metric is often associated with investor Peter Lynch, who helped popularize the concept of comparing valuation with earnings growth.
PEG Ratio Formula
The standard PEG ratio formula is:
PEG Ratio = P/E Ratio ÷ Earnings Growth Rate
For example:
- P/E ratio = 25
- Earnings growth rate = 20%
Therefore:
PEG = 25 ÷ 20 = 1.25
One important point is that the growth rate is normally entered as a whole number in this calculation.
So:
20% growth → 20
not:
0.20
Using 0.20 would produce a completely different and misleading result.
How the PEG Formula Works
The relationship is straightforward.
If the P/E ratio increases while growth remains unchanged, the PEG ratio increases.
If expected earnings growth increases while P/E remains unchanged, the PEG ratio decreases.
For example:
P/E = 30
If growth is 15%:
PEG = 30 ÷ 15 = 2.0
But if growth is 30%:
PEG = 30 ÷ 30 = 1.0
This illustrates the central concept of PEG:
A higher P/E doesn’t necessarily mean a higher PEG if the company also has substantially higher growth.
PEG Ratio Formula Using EPS Growth
The P/E ratio itself is generally calculated as:
P/E = Share Price ÷ Earnings Per Share (EPS)
PEG then takes that P/E and compares it with the earnings growth rate.
Therefore:
PEG = (Share Price ÷ EPS) ÷ EPS Growth Rate
You normally don’t need to calculate the entire expression manually because financial websites often provide P/E and growth data separately.
How to Calculate the PEG Ratio: Step-by-Step
Calculating PEG is relatively simple, but selecting the correct inputs is more important than the arithmetic.
Step 1: Find the P/E Ratio
First, determine the company’s P/E ratio.
There are two commonly encountered versions:
Trailing P/E: Based on earnings from the past 12 months.
Forward P/E: Based on expected future earnings.
The distinction matters because the growth figure used with PEG should be consistent with the valuation methodology.
Step 2: Determine the Earnings Growth Rate
Next, determine the company’s earnings growth rate.
This might be:
- historical EPS growth
- expected future EPS growth
- a multi-year earnings growth rate
- an analyst consensus forecast
Different websites may use different definitions.
Step 3: Divide P/E by Growth
Suppose:
- P/E = 24
- Earnings growth = 20%
Then:
PEG = 24 ÷ 20 = 1.20
Step 4: Interpret the Result in Context
This is where investors need to be careful.
A PEG of 1.20 doesn’t automatically mean the stock is expensive.
Similarly, a PEG of 0.70 doesn’t automatically mean the stock is cheap.
You need to investigate why the PEG is at that level and whether the growth assumption is realistic.
PEG Ratio Example
Let’s use a hypothetical company called ABC Ltd.
Suppose:
- Share price = ₹300
- EPS = ₹10
- P/E ratio = 30
- Expected annual EPS growth = 25%
The PEG calculation is:
PEG = 30 ÷ 25
PEG = 1.20
The result is 1.20.
This means the company’s P/E multiple of 30 is being compared with an expected earnings-growth rate of 25%.
It does not mean that the company is automatically overvalued.
You would still want to investigate:
- whether 25% growth is realistic
- how long that growth can continue
- whether historical earnings support the forecast
- whether margins are improving
- whether debt is increasing
- whether free cash flow supports earnings
- how competitors are valued
- whether the industry itself is cyclical
The calculation is simple. The interpretation is where the real analysis begins.
Comparing Two Companies Using PEG
PEG becomes particularly useful when comparing companies with different P/E ratios and growth rates.
Consider two hypothetical companies:
| Company | P/E Ratio | EPS Growth | PEG |
|---|---|---|---|
| Company A | 30 | 30% | 1.00 |
| Company B | 15 | 10% | 1.50 |
Looking only at P/E, Company B appears significantly cheaper.
But after considering growth, Company A has the lower PEG.
This illustrates an important lesson:
The company with the lower P/E ratio does not necessarily have the lower valuation relative to growth.
However, this still doesn’t tell us which company is the better investment.
Company A could have a weak balance sheet, unreliable growth estimates, or unsustainable earnings.
Company B could have stronger cash flow, a superior competitive position, and more predictable profits.
That’s why PEG should be used as part of a broader fundamental analysis rather than as a standalone decision-making tool.
What Does the PEG Ratio Mean?
The traditional interpretation of PEG is relatively simple.
PEG Below 1
A PEG below 1 is often interpreted as potentially attractive because the P/E ratio is relatively low compared with the stated earnings growth rate.
For example:
P/E = 18
Growth = 25%
PEG = 0.72
However, a PEG below 1 is not proof that a stock is undervalued.
The growth rate could be temporary or overly optimistic.
PEG Around 1
A PEG of approximately 1 is traditionally viewed as a rough balance between valuation and growth.
For example:
P/E = 20
Growth = 20%
PEG = 1.0
This is sometimes described as a reasonable valuation relative to growth.
But it is only a rule of thumb.
There is no economic law saying that every company with a PEG of 1 is fairly valued.
PEG Above 1
A PEG above 1 means the P/E ratio is relatively high compared with the stated earnings growth rate.
For example:
P/E = 30
Growth = 15%
PEG = 2.0
This may indicate that investors are paying a relatively high valuation for the company’s expected growth.
But again, it doesn’t automatically mean the stock is overvalued.
A company may have a high PEG because the market expects other benefits that aren’t fully captured by the simple growth calculation.
What Does a Very High PEG Mean?
A very high PEG can indicate that the company’s valuation is high compared with its expected earnings growth.
It may be worth investigating whether:
- the stock price has risen significantly
- growth estimates have fallen
- the company is experiencing slowing growth
- the market expects future improvements not captured in current forecasts
The important question isn’t simply whether PEG is high.
It’s why it is high.
What Does a Negative PEG Ratio Mean?
A negative PEG ratio can occur when the P/E ratio or earnings growth rate is negative.
This creates an important problem.
PEG assumes that comparing valuation with positive earnings growth provides meaningful information. When earnings or growth are negative, the resulting ratio can become difficult or meaningless to interpret.
Therefore, a negative PEG should generally be treated as a warning that the standard PEG framework may not be appropriate for that company.
What Is a Good PEG Ratio?
There is no universal PEG ratio that makes a stock automatically attractive.
The traditional rule of thumb is:
| PEG | Traditional Interpretation |
|---|---|
| Below 1 | Potentially attractive relative to growth |
| Around 1 | Roughly balanced valuation and growth |
| Above 1 | Higher valuation relative to growth |
| Well above 1 | Potentially expensive relative to stated growth |
These numbers are useful as a starting point, not as rigid investment rules.
A PEG of 0.8 for a cyclical company with unreliable earnings may be less attractive than a PEG of 1.3 for a company with highly predictable earnings and strong cash generation.
Why PEG < 1 Is Not Always a Bargain
This is one of the most important things to understand about PEG.
Suppose a company has:
P/E = 12
Expected growth = 20%
PEG:
12 ÷ 20 = 0.60
That looks attractive.
But what if the 20% growth estimate exists only because the previous year’s earnings were unusually low?
For example, if EPS increased from ₹5 to ₹6, that’s a 20% increase.
But if the company’s normal EPS is around ₹8, the apparent growth may not represent a sustainable improvement in the business.
Similarly, the growth estimate may be based on optimistic forecasts.
Therefore:
A low PEG tells you that valuation looks low relative to the stated growth rate. It does not prove that the growth will actually occur.
Which Growth Rate Should You Use for PEG?
This is one of the most important questions when calculating PEG.
The answer is not always obvious.
Historical EPS Growth
Historical earnings growth measures what the company has already achieved.
For example, if EPS increased from ₹10 to ₹15 over a period of time, you can calculate the historical growth rate.
The advantage is that you’re working with actual results.
The disadvantage is that:
Past growth does not guarantee future growth.
A company may have benefited from favorable economic conditions that are unlikely to repeat.
Expected Future EPS Growth
Forward growth estimates attempt to answer a different question:
How quickly are earnings expected to grow in the future?
This can be more useful when evaluating future valuation.
However, it introduces another risk:
Forecasts can be wrong.
Analysts can underestimate or overestimate future earnings.
One-Year Growth vs. Multi-Year Growth
One-year growth can sometimes be misleading.
Suppose EPS increases from ₹5 to ₹10.
That’s 100% growth.
But if EPS then increases from ₹10 to ₹11, the next year’s growth is only 10%.
The first year may have benefited from a temporary recovery.
For this reason, multi-year growth rates can sometimes provide a more useful picture of the company’s underlying earnings trajectory.
Trailing PEG vs. Forward PEG
A trailing approach may combine a current or trailing P/E with historical earnings growth.
A forward approach may combine a forward P/E with expected future earnings growth.
The important principle is consistency.
Don’t blindly compare PEG values without knowing how each one was calculated.
Why PEG Values Can Differ Across Websites
You may notice that one financial website reports a company’s PEG as 0.9 while another reports 1.4.
That doesn’t necessarily mean one website is wrong.
They may use different:
- P/E definitions
- EPS periods
- growth estimates
- analyst forecasts
- fiscal years
- calculation methodologies
Therefore, whenever PEG is important to your analysis, check how the number was calculated.
PEG Ratio vs. P/E Ratio
P/E and PEG are related but answer slightly different questions.
| Feature | P/E Ratio | PEG Ratio |
|---|---|---|
| Measures | Price relative to earnings | P/E relative to earnings growth |
| Includes growth? | No | Yes |
| Simplicity | Very simple | More complex |
| Forecast dependency | Lower | Often higher |
| Useful for growth stocks | Yes, but limited | Often more informative |
| Standalone metric? | No | No |
The biggest difference is growth.
A company with a P/E of 30 might look expensive.
But if it is expected to grow earnings substantially faster than a company with a P/E of 15, the comparison changes.
PEG attempts to capture this relationship.
However, PEG doesn’t replace P/E.
A good analysis can use both.
PEG Ratio vs. Other Valuation Ratios
PEG is only one valuation metric among many.
PEG vs. P/B Ratio
The Price-to-Book (P/B) ratio compares a company’s market value with its book value.
It can be particularly relevant for businesses where assets and book value are important, such as financial institutions.
PEG, by contrast, focuses on earnings growth.
PEG vs. P/S Ratio
The Price-to-Sales (P/S) ratio compares market value with revenue.
It can be useful when a company has low or negative earnings and therefore doesn’t have a meaningful P/E ratio.
PEG requires meaningful earnings and growth inputs, so it may not work well in those circumstances.
PEG vs. EV/EBITDA
EV/EBITDA compares enterprise value with earnings before interest, taxes, depreciation and amortization.
It takes capital structure into consideration differently from P/E.
For companies with significant debt or different capital structures, EV/EBITDA can provide useful additional information.
PEG vs. PEGY
The PEGY ratio is a variation of PEG that incorporates dividend yield.
The basic idea is to consider not only earnings growth but also the income generated by dividends.
This can be useful when comparing companies that have different dividend policies.
When Is the PEG Ratio Most Useful?
PEG can be particularly useful in certain situations.
Comparing Growth Companies
If two companies operate in similar industries but have different growth rates, PEG can provide an additional layer of comparison.
For example, a P/E of 35 may not tell you much by itself.
Knowing that the company is expected to grow earnings at 40% provides more context.
Screening Stocks
PEG can be useful as an initial stock-screening metric.
For example, an investor could identify companies with:
- positive earnings
- strong historical growth
- reasonable PEG ratios
But screening is only the beginning.
The companies that pass the screen still need fundamental research.
Comparing Companies Within the Same Industry
PEG is generally more meaningful when comparing businesses with similar characteristics.
Comparing a bank with a software company purely based on PEG can produce misleading conclusions because their business models, accounting structures, capital requirements and growth profiles are very different.
Evaluating Growth at a Reasonable Price
PEG is closely related to the GARP approach.
GARP investors generally look for companies with meaningful growth potential without paying an excessively high valuation for that growth.
PEG can therefore serve as one tool in a GARP-oriented analysis.
When Should You Avoid Relying on the PEG Ratio?
PEG isn’t appropriate for every company.
Companies With Negative Earnings
If a company has negative earnings, P/E may already be difficult to interpret.
PEG becomes even less useful.
In such cases, investors may need to examine revenue growth, gross margins, operating cash flow, balance-sheet strength and other metrics.
Very Low-Growth Companies
Suppose a company is expected to grow earnings by only 2%.
A small change in the growth estimate can dramatically change the PEG ratio.
This makes the metric particularly sensitive.
Cyclical Companies
Cyclical businesses can experience large changes in earnings depending on commodity prices, economic conditions and demand.
A company near the bottom of its earnings cycle may suddenly show very high growth.
That can make PEG look unusually low.
The reverse can happen near the top of a cycle.
Companies With Highly Volatile Earnings
If earnings move dramatically from year to year, a simple growth rate may not represent the company’s sustainable earnings power.
Companies With Unreliable Growth Forecasts
PEG can be heavily influenced by forward earnings estimates.
If analysts expect 30% growth but actual growth ends up at 5%, the PEG calculation based on the original forecast can look completely different in hindsight.
The Biggest Limitations of the PEG Ratio
The PEG ratio is useful, but it has several important limitations.
PEG Depends on Growth Estimates
This is probably the biggest limitation.
The formula may look precise:
PEG = 0.85
But the number 0.85 can create a false sense of certainty if the growth estimate itself is uncertain.
A ratio calculated using an inaccurate growth forecast is still inaccurate.
PEG Does Not Measure Business Quality
Two companies can have exactly the same PEG but dramatically different business quality.
One might have:
- strong competitive advantages
- high returns on capital
- low debt
- strong cash flow
while another might have:
- weak margins
- high debt
- declining customer demand
- poor cash conversion
PEG doesn’t capture these differences.
PEG Ignores Balance-Sheet Risk
A company can have an attractive PEG while carrying substantial debt.
Debt can increase financial risk, particularly when interest rates are high or operating profits decline.
That’s why PEG should be considered alongside leverage and balance-sheet metrics.
PEG Ignores Free Cash Flow
EPS growth isn’t necessarily the same thing as free-cash-flow growth.
A company can report growing accounting earnings while requiring substantial capital expenditure or working capital investment.
Free cash flow therefore provides another important perspective.
Growth Is Not Linear Forever
A company growing earnings by 40% today may not be able to maintain that growth rate for the next decade.
As companies become larger, maintaining very high growth generally becomes more difficult.
This is particularly important when PEG uses short-term growth forecasts.
Accounting Can Distort EPS Growth
EPS can be influenced by factors such as:
- share buybacks
- one-time gains
- restructuring charges
- asset sales
- unusually weak prior-year earnings
Therefore, investors should investigate the source of earnings growth rather than accepting the growth percentage at face value.
How to Use PEG Ratio With Other Fundamental Metrics
A better approach is to treat PEG as one component of a broader analytical framework.
A useful sequence is:
PEG → Growth → Profitability → Balance Sheet → Cash Flow → Valuation → Business Quality
PEG + P/E
Use P/E to understand how much investors are currently paying for earnings.
Then use PEG to put that valuation into a growth context.
PEG + EPS Growth
Don’t simply accept the growth number.
Look at the company’s historical earnings trajectory and determine whether the expected growth appears realistic.
PEG + ROE/ROIC
Return on Equity (ROE) and Return on Invested Capital (ROIC) can help evaluate how efficiently a company generates returns.
High growth supported by poor capital efficiency deserves more scrutiny.
PEG + Debt-to-Equity
Check whether the company is using substantial debt to support expansion.
Growth financed by excessive leverage can carry considerably more risk than growth generated from a strong balance sheet.
PEG + Free Cash Flow
Compare earnings growth with free-cash-flow growth.
If EPS is growing rapidly but free cash flow isn’t keeping pace, investigate why.
PEG + Operating Margin
Look at whether profitability is improving alongside revenue and earnings growth.
Rapid revenue growth accompanied by declining margins may tell a very different story from growth accompanied by expanding margins.
A Practical PEG Ratio Checklist for Investors
Before relying heavily on a company’s PEG ratio, ask:
Is the company profitable?
If not, PEG may not be appropriate.
Is earnings growth positive?
Negative or extremely low growth can make PEG difficult to interpret.
Where did the growth come from?
Determine whether it came from genuine business expansion, a low base, cost cutting, acquisitions, buybacks or temporary factors.
Is the growth forecast realistic?
Don’t assume analyst forecasts will automatically become reality.
Is the company carrying significant debt?
PEG doesn’t directly tell you about financial leverage.
Does free cash flow support reported earnings?
Strong earnings with weak cash generation deserve additional investigation.
How does the PEG compare with direct competitors?
Peer comparison can provide useful context.
Is current growth unusually high because of a low base?
A temporary rebound can make PEG appear artificially attractive.
Would the valuation still look reasonable if growth were lower than expected?
This is one of the most useful questions an investor can ask.
PEG Ratio for Indian Stocks
The PEG ratio works on the same basic principle whether you’re analyzing stocks listed in India, the United States or another market.
For Indian investors, PEG can be used alongside other metrics when evaluating companies listed on the NSE or BSE.
However, sector comparison remains important.
How PEG Is Used in Indian Stock Analysis
An investor might compare companies within sectors such as:
- IT
- FMCG
- manufacturing
- pharmaceuticals
- financial services
- consumer businesses
But the appropriate valuation framework can differ significantly between sectors.
Where Indian Investors Can Find PEG Data
Financial websites and stock screeners may provide PEG directly.
Indian investors can also calculate it manually using the company’s P/E ratio and an appropriate earnings-growth rate.
For example:
P/E = 28
Expected earnings growth = 24%
PEG = 28 ÷ 24 = 1.17
If you use a website’s PEG figure, always check the methodology before comparing it with another source.
Why Indian Investors Should Not Compare PEG Across Every Sector
A PEG ratio of 1.2 for a bank and 1.2 for an IT company does not necessarily mean the two companies have identical valuation characteristics.
Different industries have different:
- growth rates
- capital requirements
- margins
- leverage
- economic sensitivity
- accounting characteristics
- competitive structures
Sector and peer context therefore matter.
Common PEG Ratio Mistakes Investors Make
Treating PEG Below 1 as a Buy Signal
A PEG below 1 can be interesting, but it isn’t a recommendation by itself.
The growth assumption may be wrong.
Using a Growth Rate Without Checking Its Source
Always understand whether the growth figure is:
- historical
- projected
- analyst consensus
- one-year
- multi-year
Comparing PEGs From Different Methodologies
A PEG calculated using historical growth shouldn’t automatically be compared with another company’s PEG calculated using forward growth.
Ignoring Cyclicality
Temporary earnings rebounds can create unusually attractive PEG values.
Ignoring Debt and Cash Flow
PEG doesn’t tell you whether the company’s balance sheet is strong or whether profits are converting into cash.
Using PEG as a Standalone Valuation Model
PEG is a relative valuation metric.
It is not a complete intrinsic-value model.
It doesn’t tell you what a company is worth under different future scenarios.
A Worked Example: How PEG Can Give the Wrong Impression
Consider two hypothetical companies.
Company A
- P/E = 20
- Earnings growth = 25%
- PEG = 0.80
Company B
- P/E = 30
- Earnings growth = 30%
- PEG = 1.00
Based purely on PEG, Company A appears more attractive.
But now suppose we discover something else.
Company A’s 25% growth came primarily from a depressed earnings base. Its debt is increasing, margins are declining and free cash flow is weak.
Company B has a higher P/E, but it has:
- stronger margins
- a healthier balance sheet
- more predictable earnings
- stronger free cash flow
- a more established competitive position
Does the lower PEG automatically make Company A the better investment?
No.
This example demonstrates a fundamental principle of financial analysis:
A valuation ratio is only as useful as the assumptions and business fundamentals behind it.
The purpose of PEG isn’t to eliminate fundamental analysis.
It is to make that analysis more informative.
PEG Ratio and the GARP Investing Strategy
PEG is often associated with GARP, which stands for Growth at a Reasonable Price.
The basic idea behind GARP is to look for companies that offer meaningful earnings growth without requiring investors to pay an excessively high valuation.
PEG fits naturally into this framework because it relates valuation to growth.
However, investors should remember:
GARP is an investing framework, not a guarantee of superior returns.
A company can have strong expected growth and a reasonable PEG but still disappoint if:
- growth slows
- competition increases
- margins decline
- forecasts prove inaccurate
- the valuation multiple contracts
- the broader market falls
How to Find a Stock’s PEG Ratio
There are two main approaches.
Using a Financial Website
Many financial websites and stock-screening platforms provide PEG directly.
If you use a published PEG figure, check:
- Which P/E ratio was used?
- Which earnings period was used?
- Which growth rate was used?
- Is growth historical or forward?
- When was the data last updated?
This prevents misleading comparisons.
Calculating PEG Yourself
You can calculate PEG using:
PEG = P/E ÷ Earnings Growth Rate
For example:
P/E = 22
Growth = 18%
PEG = 22 ÷ 18 = 1.22
Calculating PEG yourself can be useful because it forces you to understand the assumptions behind the number.
Check the Methodology
Never assume that two PEG numbers are directly comparable just because they have the same label.
Always investigate the underlying inputs.
Is the PEG Ratio Better Than the P/E Ratio?
Neither is universally better.
The P/E ratio is simpler and directly tells you how much investors are paying relative to earnings.
PEG adds an additional dimension by considering earnings growth.
But PEG also introduces more uncertainty because the growth estimate can be subjective.
A useful way to think about them is:
P/E: “How expensive are these earnings?”
PEG: “How expensive are these earnings relative to their growth?”
Both can be useful.
Neither should be used in isolation.
Frequently Asked Questions About the PEG Ratio
What is a good PEG ratio?
A PEG around 1 is traditionally considered reasonable relative to growth, while a PEG below 1 may appear attractive. However, there is no universal threshold that determines whether a stock is a good investment. The reliability of the growth estimate and the company’s fundamentals matter considerably.
Is a PEG ratio below 1 good?
A PEG below 1 can indicate that the P/E ratio is relatively low compared with the stated earnings-growth rate. However, it does not automatically mean the stock is undervalued. The growth rate could be temporary, unrealistic or based on a low earnings base.
Is a higher or lower PEG ratio better?
Generally, a lower PEG is considered more attractive when comparing companies with similar characteristics and reliable growth estimates. However, a lower PEG does not automatically indicate a better investment.
What does a PEG ratio of 1 mean?
A PEG of 1 means the P/E ratio and the stated earnings-growth percentage are equal. For example, a P/E of 20 divided by 20% growth produces a PEG of 1. It is traditionally viewed as a rough balance between valuation and growth.
What does a PEG ratio above 2 mean?
A PEG above 2 means the P/E ratio is relatively high compared with the stated earnings-growth rate. It may indicate that investors are paying a significant premium for the company’s expected growth, but it does not independently prove that the stock is overvalued.
What does a negative PEG ratio mean?
A negative PEG can result from negative earnings, negative growth or other problematic inputs. Because PEG relies on meaningful positive earnings and growth, a negative value is often difficult to interpret and may make the metric unsuitable for the company.
How do you calculate the PEG ratio?
The standard formula is:
PEG Ratio = P/E Ratio ÷ Earnings Growth Rate
For example, a P/E of 25 and earnings growth of 20% gives a PEG of 1.25.
What growth rate should be used for PEG?
The appropriate growth rate depends on the methodology. Historical earnings growth can be used to evaluate past performance, while expected future growth can make PEG more forward-looking. The important thing is to understand the source and use consistent inputs.
Is PEG better than P/E?
PEG is not necessarily better than P/E. It adds an earnings-growth component but also depends more heavily on growth estimates. P/E and PEG are best viewed as complementary valuation metrics.
Can PEG be used for all stocks?
No. PEG is most useful when a company has meaningful positive earnings and a reasonably interpretable growth rate. It can be less useful for companies with negative earnings, highly cyclical profits, extremely low growth or highly uncertain forecasts.
Why do different websites show different PEG ratios?
Different websites may use different P/E periods, earnings estimates, growth forecasts and calculation methodologies. Always check the methodology before comparing PEG figures from different sources.
The PEG ratio is a valuation metric that compares a company’s P/E ratio with its earnings growth rate.
The basic formula is:
PEG Ratio = P/E Ratio ÷ Earnings Growth Rate
A lower PEG can indicate a lower valuation relative to stated growth, while a higher PEG indicates a higher valuation relative to stated growth.
But there is a critical caveat:
PEG is not a standalone measure of whether a stock is cheap or expensive.
The growth estimate may be inaccurate. Earnings may be cyclical. Debt may be high. Free cash flow may be weak. And a company’s current growth rate may not be sustainable.
Therefore, PEG is most useful when combined with other measures of valuation, profitability, financial strength and business quality.
Conclusion: Use PEG as a Starting Point, Not a Final Answer
The PEG ratio is useful because it connects three important concepts: price, earnings and growth.
A P/E ratio can tell you how much investors are paying for a company’s earnings. PEG goes one step further by asking whether that valuation appears reasonable relative to the company’s earnings growth.
But the number itself is not the complete story.
A PEG of 0.7 isn’t automatically a bargain, just as a PEG of 1.5 isn’t automatically expensive.
The most important question is:
Why is the PEG ratio at this level, and are the assumptions behind it sustainable?
Before relying on PEG, examine the company’s earnings quality, growth history, future growth assumptions, margins, debt, free cash flow and competitive position. Compare the company with relevant peers and understand how the PEG figure was calculated.
For beginners, the most useful lesson is simple:
Don’t use PEG to find a number that tells you what to buy. Use PEG to ask better questions about valuation and growth.
And for serious investors, that distinction is crucial. Financial ratios are tools for analysis—not guarantees of future returns.
Related Posts:
- Financial Ratios Explained: PE, PB, ROE & How to Analyze Any Stock
- Price to Sales Ratio (P/S): Formula, Meaning & Calculation
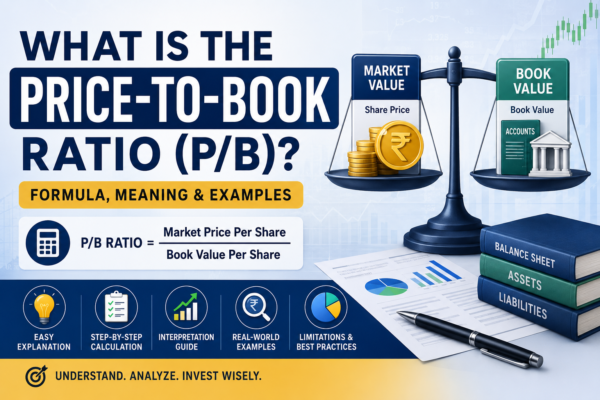
- What Is the Price-to-Book Ratio? Formula, Meaning & Examples
- P/E Ratio: Meaning, Formula, Examples & How to Analyze It
- What Is EBITDA? Meaning, Formula, Calculation & Examples
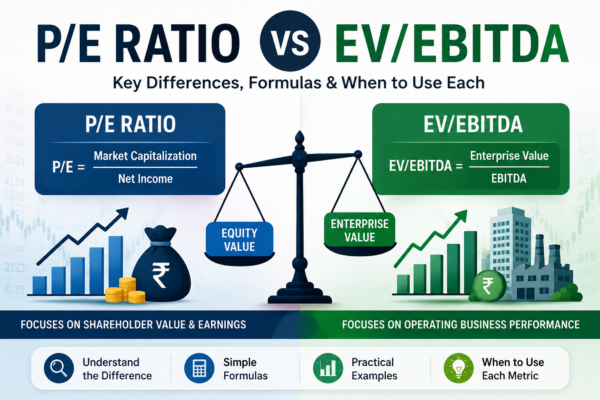
- P/E Ratio vs EV/EBITDA: Differences, Formulas & Examples
- What Is EPS? Earnings Per Share Explained With Formula, Examples & How to Analyze It
- How to Value a Stock: Complete Stock Valuation Guide

You may also like

Price to Sales Ratio (P/S): Formula, Meaning & Calculation
What Is the Price-to-Book Ratio? Formula, Meaning & Examples