P/E Ratio vs EV/EBITDA: Differences, Formulas & Examples
P/E Ratio vs EV/EBITDA: Key Differences, Formulas, Examples & When to Use Each
When investors evaluate a company’s valuation, two of the most commonly used metrics are the P/E ratio and EV/EBITDA. Although both are valuation multiples, they measure different things.
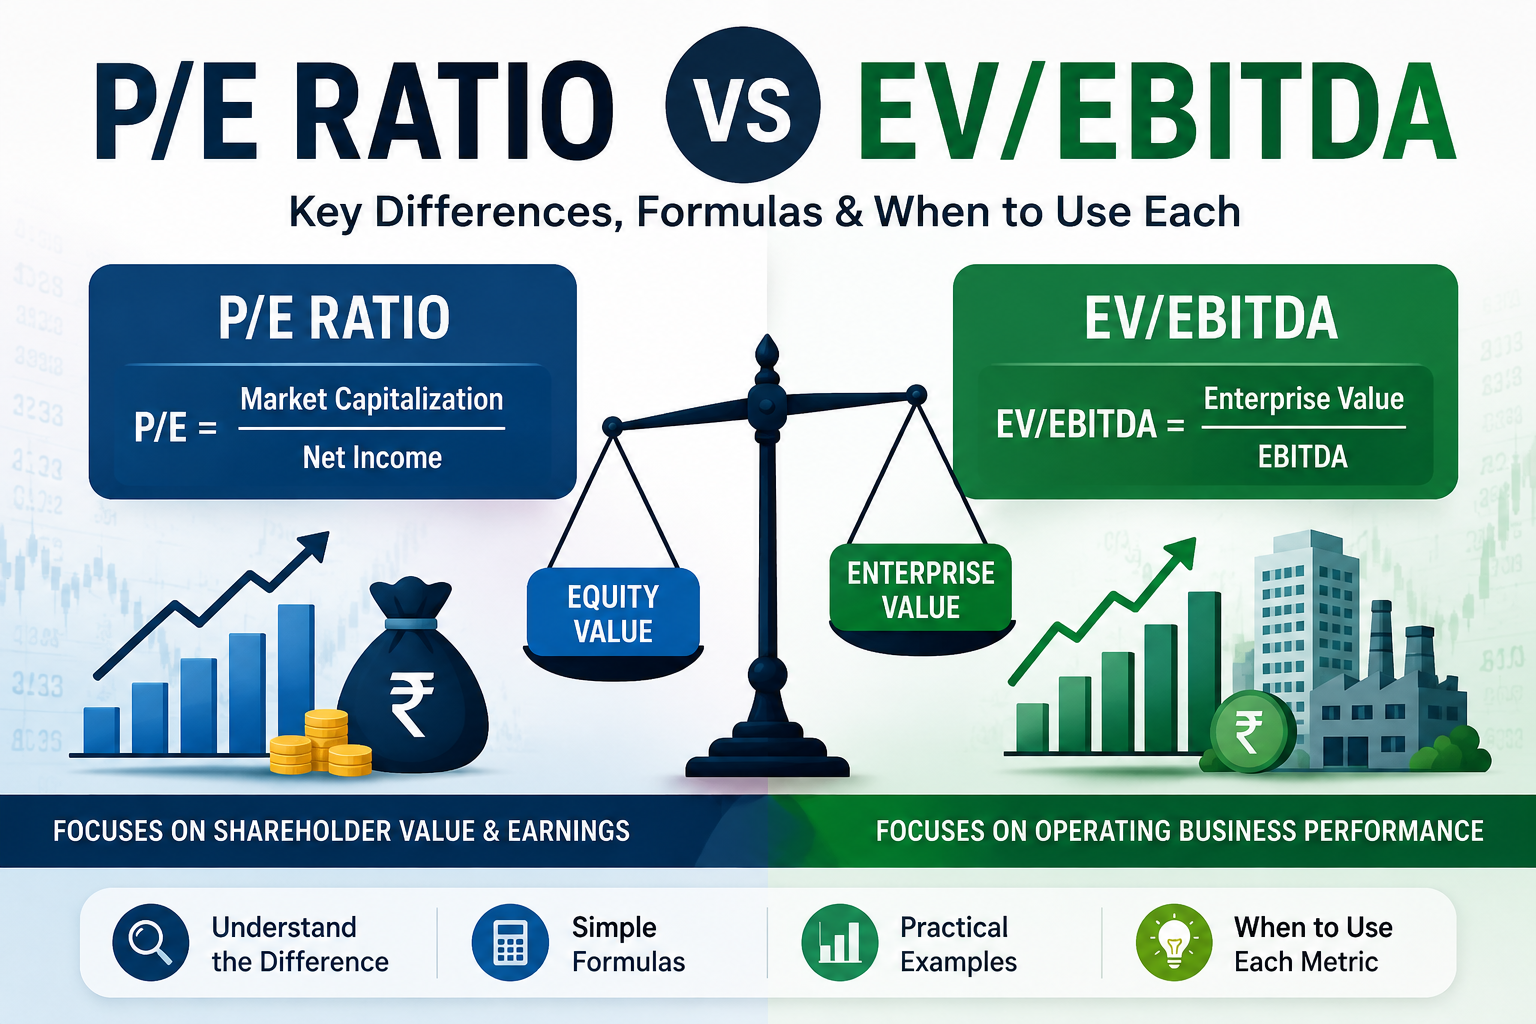
The P/E ratio compares a company’s equity value with its net profit attributable to shareholders. EV/EBITDA compares the value of the entire business with its earnings before interest, taxes, depreciation and amortization.
In simple terms, P/E focuses on what shareholders are paying for earnings, while EV/EBITDA focuses on what the market is paying for the operating business.
Neither ratio is automatically better than the other. The right metric depends on the company’s capital structure, industry, profitability, debt levels, accounting characteristics, and the question you are trying to answer.
This guide explains the difference between P/E and EV/EBITDA, their formulas, practical examples, advantages, limitations, industry applications, and how investors can use both metrics together.
Table of Contents
P/E Ratio vs EV/EBITDA: What’s the Difference?
The most important difference is the level at which each valuation multiple operates.
P/E is an equity valuation multiple. It compares the market value belonging to shareholders with the company’s net income.
EV/EBITDA is an enterprise valuation multiple. It compares the value of the entire operating business—including the interests of debt holders and equity holders—with EBITDA.
The basic formulas are:
P/E = Market Capitalization ÷ Net Income
or, on a per-share basis:
P/E = Share Price ÷ EPS
For EV/EBITDA:
EV/EBITDA = Enterprise Value ÷ EBITDA
The distinction becomes especially important when two companies have different levels of debt.
P/E vs EV/EBITDA at a Glance
| Factor | P/E Ratio | EV/EBITDA |
|---|---|---|
| Full name | Price-to-Earnings | Enterprise Value-to-EBITDA |
| Valuation level | Equity | Enterprise |
| Numerator | Market capitalization | Enterprise value |
| Denominator | Net income/EPS | EBITDA |
| Interest expense | Reflected in net income | Excluded |
| Taxes | Reflected in net income | Excluded |
| Depreciation | Reflected in net income | Added back |
| Effect of debt | Significant | Relatively lower |
| Negative earnings | Usually unusable | Potentially usable if EBITDA is positive |
| M&A analysis | Less direct | Frequently useful |
| Main question | What am I paying for shareholder earnings? | What am I paying for the operating business? |
The key takeaway is that P/E and EV/EBITDA should not be treated as interchangeable ratios.
What Is the P/E Ratio?
The price-to-earnings ratio, commonly called P/E or PE, is one of the most widely used valuation multiples in stock analysis.
It tells you how much investors are paying for each unit of a company’s earnings.
P/E Ratio Formula
The basic formula is:
P/E = Market Price per Share ÷ Earnings per Share (EPS)
For example, suppose a company’s stock trades at ₹500 and its annual EPS is ₹25.
Therefore:
P/E = ₹500 ÷ ₹25 = 20
The company has a P/E ratio of 20×.
The same calculation can be performed at the company level:
P/E = Market Capitalization ÷ Net Income
If the company has a market capitalization of ₹1,000 crore and earns ₹50 crore in net profit:
P/E = ₹1,000 crore ÷ ₹50 crore = 20×
What Does a P/E Ratio Actually Tell You?
A 20× P/E means investors are currently valuing the company’s equity at approximately 20 times its annual earnings.
It does not mean that an investor is guaranteed to recover their investment in exactly 20 years.
That interpretation is too simplistic because earnings can grow or decline, valuation multiples can change, and profits are not necessarily distributed entirely to shareholders.
Instead, think of P/E as a price investors are willing to pay relative to current earnings.
Why Do Investors Use P/E?
P/E is popular because it is relatively simple and directly connected to shareholder profitability.
For profitable companies with reasonably stable earnings, it can be a useful starting point for comparing valuation across similar businesses.
For example, if two companies operate in the same industry, have similar growth prospects and similar risk profiles, but one trades at a significantly higher P/E, investors may want to understand why.
The higher multiple might be justified by faster growth, better margins, stronger competitive advantages, lower risk, or better capital allocation.
Problems With P/E
P/E has an important weakness: net income is affected by many factors that have little to do with the underlying operating performance of a business.
Interest expense, taxes, depreciation, one-time gains and losses, and capital structure can all influence net income.
This means two companies with similar operating businesses can have very different P/E ratios.
P/E also becomes difficult to interpret when earnings are negative.
If a company loses ₹10 crore, dividing its market capitalization by negative earnings produces a negative P/E. A negative P/E generally does not provide the same intuitive valuation information as a positive P/E.
What Is EV/EBITDA?
EV/EBITDA stands for Enterprise Value to Earnings Before Interest, Taxes, Depreciation and Amortization.
It is another widely used valuation multiple, particularly in corporate finance, mergers and acquisitions, private equity and comparative company analysis.
The formula is:
EV/EBITDA = Enterprise Value ÷ EBITDA
To understand the ratio, you first need to understand enterprise value and EBITDA.
What Is Enterprise Value?
Enterprise value, or EV, is an estimate of the value of the operating business available to all capital providers.
A simplified formula is:
Enterprise Value = Market Capitalization + Debt − Cash
For example, imagine a company has:
- Market capitalization = ₹1,000 crore
- Debt = ₹300 crore
- Cash = ₹100 crore
Then:
EV = ₹1,000 + ₹300 − ₹100
EV = ₹1,200 crore
The reason debt is added is that an acquirer effectively takes responsibility for the company’s debt.
Cash is subtracted because cash is an asset that can be used by the acquirer and therefore reduces the effective cost of acquiring the operating business.
A complete enterprise-value calculation can involve additional items such as preferred equity and non-controlling interests, but market capitalization plus debt minus cash is a useful simplified framework for learning.
What Is EBITDA?
EBITDA means:
Earnings Before Interest, Taxes, Depreciation and Amortization
It is commonly used as a measure of operating performance before certain financing, tax and non-cash accounting expenses.
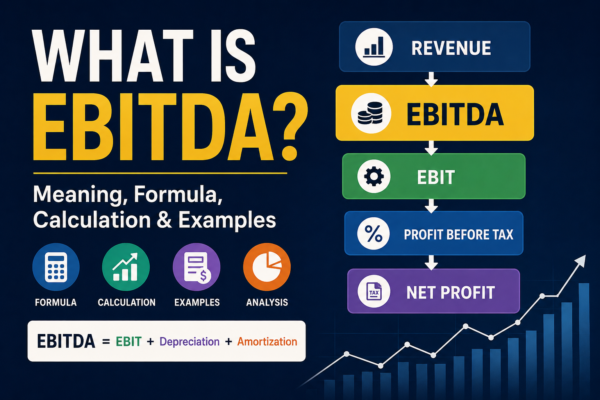
A simplified bridge is:
Revenue
− Operating expenses
= EBITDA
Then:
EBITDA
− Depreciation & Amortization
= EBIT
After that:
EBIT
− Interest
= Pre-tax income
And finally:
Pre-tax income
− Taxes
= Net income
This bridge is extremely important for understanding the difference between P/E and EV/EBITDA.
EBITDA Is Not Free Cash Flow
One of the most important concepts investors should understand is that EBITDA is not the same as cash flow.
EBITDA does not account for capital expenditure, working-capital requirements, taxes, interest payments or debt repayment.
A business could report strong EBITDA while simultaneously requiring substantial amounts of cash to maintain or expand its assets.
Therefore, EV/EBITDA should be used as a valuation multiple—not as a substitute for analyzing cash generation.
What Does EV/EBITDA Actually Tell You?
Suppose a company has:
- Enterprise value = ₹1,000 crore
- EBITDA = ₹100 crore
Then:
EV/EBITDA = ₹1,000 ÷ ₹100 = 10×
The company is valued at 10 times its EBITDA.
This provides a way to compare the valuation of businesses while reducing some of the distortions created by differences in financing and tax structures.
However, the multiple should not be interpreted as a guaranteed 10-year investment payback period.
Actual cash returns depend on taxes, capital expenditure, working capital, interest, debt repayment, growth, and many other factors.
P/E Ratio vs EV/EBITDA: The Fundamental Difference
The easiest way to understand the difference is to ask what each metric considers to be the value of the business and what it considers to be earnings.
P/E:
Equity Value → Net Income
EV/EBITDA:
Enterprise Value → EBITDA
P/E starts with the value belonging to equity shareholders and compares it with the profit remaining after interest and taxes.
EV/EBITDA starts with enterprise value and compares it with earnings before interest and taxes.
This difference is why the two ratios can produce very different conclusions about the same company.
Equity Value vs Enterprise Value
Consider a fictional company called ABC Ltd.
Suppose:
- Market capitalization = ₹1,000 crore
- Debt = ₹300 crore
- Cash = ₹100 crore
Its enterprise value is:
₹1,000 crore + ₹300 crore − ₹100 crore = ₹1,200 crore
P/E uses the ₹1,000 crore market capitalization.
EV/EBITDA uses the ₹1,200 crore enterprise value.
That ₹200 crore difference is largely related to the company’s net debt.
This is one reason EV/EBITDA can be particularly useful when comparing companies with different capital structures.
Net Income vs EBITDA
Now consider the earnings side.
Suppose ABC Ltd. has:
- EBITDA = ₹150 crore
- Depreciation and amortization = ₹30 crore
- Interest expense = ₹5 crore
- Taxes = ₹23 crore
The simplified calculation is:
EBITDA = ₹150 crore
EBIT = ₹150 − ₹30 = ₹120 crore
Pre-tax income = ₹120 − ₹5 = ₹115 crore
Net income = ₹115 − ₹23 = ₹92 crore
Now the two valuation ratios are:
P/E = ₹1,000 ÷ ₹92 = 10.87×
EV/EBITDA = ₹1,200 ÷ ₹150 = 8×
The same company therefore has a P/E of approximately 10.87× and an EV/EBITDA of 8×.
Neither number is wrong.
They are simply measuring different relationships.
Why Debt Can Make P/E and EV/EBITDA Tell Different Stories
Debt is one of the biggest reasons the two multiples can diverge.
Interest expense reduces net income.
Because P/E uses net income, higher interest costs can significantly reduce earnings and increase the P/E ratio.
EV/EBITDA, however, excludes interest from EBITDA.
At the same time, debt is included in enterprise value.
This means EV/EBITDA partially neutralizes the effect of financing structure when comparing operating businesses.
A Simple Example
Imagine two companies, Company A and Company B.
Both have:
- EBITDA = ₹100 crore
- Similar operating businesses
- Similar enterprise values
But Company B has significantly more debt.
Company B therefore has higher interest expense.
That higher interest expense reduces Company B’s net income.
As a result, Company B may have a much higher P/E despite having similar EV/EBITDA.
This is why looking at only P/E can make two operationally similar companies appear more different than they actually are.
However, this does not mean debt is irrelevant when using EV/EBITDA.
Debt still matters enormously because debt increases financial risk and must eventually be serviced or repaid.
A Realistic Numerical Example: P/E vs EV/EBITDA
Let’s work through a complete fictional company.
Assume XYZ Ltd. has:
- Market capitalization: ₹1,000 crore
- Debt: ₹300 crore
- Cash: ₹100 crore
- EBITDA: ₹150 crore
- Depreciation & amortization: ₹30 crore
- Interest expense: ₹5 crore
- Taxes: ₹23 crore
Step 1: Calculate Enterprise Value
EV = Market Cap + Debt − Cash
EV = ₹1,000 + ₹300 − ₹100
EV = ₹1,200 crore
Step 2: Calculate EBIT
EBIT = EBITDA − D&A
EBIT = ₹150 − ₹30
EBIT = ₹120 crore
Step 3: Calculate Pre-Tax Income
Pre-tax income = EBIT − Interest
Pre-tax income = ₹120 − ₹5
Pre-tax income = ₹115 crore
Step 4: Calculate Net Income
Net income = ₹115 − ₹23
Net income = ₹92 crore
Step 5: Calculate P/E
P/E = Market Cap ÷ Net Income
P/E = ₹1,000 ÷ ₹92
P/E ≈ 10.87×
Step 6: Calculate EV/EBITDA
EV/EBITDA = ₹1,200 ÷ ₹150
EV/EBITDA = 8×
So:
P/E ≈ 10.87×
EV/EBITDA = 8×
The important lesson is not which number is lower.
The important lesson is why the numbers are different.
What Happens When Debt Increases?
Suppose XYZ increases its debt significantly.
Its operating business may initially remain unchanged, meaning EBITDA remains approximately the same.
However, additional debt generally creates additional interest expense.
Higher interest expense reduces pre-tax income and therefore net income.
As net income falls:
P/E rises, all else equal.
EV/EBITDA may change less directly because EBITDA excludes interest.
This makes EV/EBITDA useful for comparing companies with different financing structures.
But remember: a heavily indebted company can still be riskier even if its EV/EBITDA appears attractive.
What Happens When Cash Increases?
Cash has a different effect.
Because cash is subtracted when calculating enterprise value, a company with a large cash balance can have a lower EV than its market capitalization.
That can reduce EV/EBITDA.
Cash does not reduce P/E in the same direct mechanical way.
Therefore, companies with substantial net cash can sometimes look relatively different depending on whether you examine P/E or EV/EBITDA.
What Happens When Depreciation Increases?
Suppose a company owns large amounts of factories, equipment or infrastructure.
It may have substantial depreciation expense.
Depreciation reduces accounting profit and therefore reduces net income.
Because EBITDA adds depreciation back, EBITDA is unaffected by depreciation itself.
Consequently, a capital-intensive company can have a relatively attractive EV/EBITDA while its P/E looks considerably higher.
This is one reason investors should examine capital expenditure and asset requirements rather than assuming that a low EV/EBITDA automatically indicates an attractive valuation.
Why Can a Company Have a Low P/E but a High EV/EBITDA?
This situation can initially appear confusing.
If P/E is low but EV/EBITDA is high, investigate the components of both ratios.
Possible explanations include:
High net debt: A large amount of debt increases enterprise value.
High interest expense: Interest reduces net income, which can actually push P/E higher rather than lower, so the exact relationship needs to be examined rather than assumed.
Non-operating income: Income outside the core operating business can increase net profit without increasing EBITDA to the same extent.
One-time gains: A temporary accounting gain can inflate net income and make P/E appear unusually low.
High depreciation: Large depreciation can create a substantial difference between EBITDA and net income.
The key lesson is that a difference between P/E and EV/EBITDA is a reason to investigate the financial statements, not a reason to choose whichever ratio looks cheaper.
Why Can EV/EBITDA Be Low but P/E Be High?
The opposite situation can also occur.
A company may have a relatively low EV/EBITDA but a high P/E because net income is significantly lower than EBITDA.
Possible causes include:
- High depreciation and amortization
- Significant interest expense
- High tax rates
- Other expenses below EBITDA
- One-time charges
- Different capital structures
For example, an infrastructure company may generate substantial EBITDA but also have significant depreciation and financing costs.
Its EV/EBITDA may therefore look moderate while its P/E is relatively high.
This is exactly why valuation should not be reduced to one multiple.
Can You Convert P/E Into EV/EBITDA?
Not directly.
P/E and EV/EBITDA use different numerators and different denominators.
To connect the two, you need information about:
- Net debt
- Depreciation and amortization
- Interest expense
- Taxes
- Potentially other claims on enterprise value
Conceptually, the bridge looks like this:
EV → EBITDA → EBIT → Pre-Tax Income → Net Income → Equity Value
You cannot simply take an 8× EV/EBITDA multiple and convert it into a specific P/E without making additional assumptions.
This is also why two companies with identical EV/EBITDA multiples can have very different P/E ratios.
When Should You Use the P/E Ratio?
P/E is particularly useful when the company is consistently profitable and the primary question concerns the value of its equity relative to earnings.
For example, suppose you are comparing two established consumer companies with relatively similar debt levels, tax structures and business models.
P/E can provide a straightforward starting point for comparison.
P/E Works Best When
P/E can be particularly informative when:
- The company has positive earnings.
- Earnings are reasonably stable.
- Capital structures are reasonably comparable.
- The companies operate in the same or similar industries.
- The investor wants to understand valuation relative to shareholder earnings.
However, P/E should still be combined with earnings growth, profitability, balance-sheet quality and cash-flow analysis.
When P/E Can Be Misleading
P/E can become less useful when:
- Earnings are negative.
- Debt levels vary substantially.
- Interest expenses are very different.
- Earnings are highly cyclical.
- There are major one-time gains or losses.
- Non-operating income is significant.
- Accounting earnings do not represent sustainable profitability.
A low P/E during a cyclical earnings peak can be especially dangerous.
A company may appear cheap precisely because its earnings are temporarily unusually high.
When Should You Use EV/EBITDA?
EV/EBITDA is particularly useful when you want to compare the operating value of companies with different financing structures.
It is also commonly used in mergers and acquisitions because an acquirer is effectively evaluating the entire business rather than simply purchasing publicly traded shares.
EV/EBITDA Works Best When
EV/EBITDA can be useful for:
- Comparing companies with different levels of debt.
- Comparing operating businesses.
- M&A analysis.
- Private-company valuation.
- Capital-intensive businesses.
- Companies with positive EBITDA but weak or negative net income.
For example, suppose Company A has little debt while Company B has substantial debt.
Comparing only P/E could make their equity earnings look very different.
EV/EBITDA can provide another perspective by focusing on enterprise value and operating earnings.
When EV/EBITDA Can Mislead You
EV/EBITDA has a major limitation: it ignores several real economic costs.
It excludes:
- Interest
- Taxes
- Depreciation
- Amortization
- Capital expenditure
- Working-capital requirements
The first four are excluded by definition, while capital expenditure and working capital are not reflected in EBITDA itself.
This matters because businesses need to spend money to maintain and grow their operations.
A factory may have high EBITDA but require substantial capital expenditure every year.
A company with low capital requirements may convert EBITDA into free cash flow much more efficiently.
Therefore, EV/EBITDA should ideally be followed by an analysis of operating cash flow, capital expenditure and free cash flow.
P/E vs EV/EBITDA by Industry
There is no single valuation multiple that works equally well for every industry.
The economics of the business matter.
Technology and Software
P/E and EV/EBITDA can both be useful for mature, profitable technology companies.
However, investors should pay attention to stock-based compensation, amortization, growth rates and the distinction between reported and adjusted earnings.
For high-growth companies with little or no profit, neither traditional P/E nor EV/EBITDA may be particularly useful.
In such cases, other metrics such as EV/revenue may sometimes provide additional context, although revenue itself does not demonstrate profitability.
Manufacturing and Industrials
EV/EBITDA can be useful for comparing industrial companies because capital structure differences can be significant.
However, depreciation and capital expenditure deserve special attention.
A business that requires large investments in factories and machinery cannot be fully evaluated using EBITDA alone.
Investors should examine:
EBITDA → EBIT → Operating Cash Flow → CapEx → Free Cash Flow
rather than stopping at EBITDA.
Telecom and Infrastructure
Telecom and infrastructure businesses often have significant debt, depreciation and capital expenditure.
EV/EBITDA can therefore be useful for comparing operating businesses.
However, the same characteristics that make EV/EBITDA useful also make its limitations important.
Large debt obligations and ongoing capital requirements can materially affect shareholder returns.
Consumer and FMCG Companies
For established consumer businesses with stable earnings, P/E can often be intuitive and useful.
Investors may also examine EV/EBITDA to understand whether differences in capital structure or depreciation are influencing the valuation comparison.
Banks and Financial Companies
Banks require special treatment.
For a bank, interest is not simply a financing cost in the same way it is for many industrial companies. Interest income and interest expense are fundamental components of the bank’s operating model.
As a result, EV/EBITDA is generally not an appropriate primary valuation framework for banks.
Metrics such as P/B, P/E, ROE and asset quality are generally more relevant when analyzing banks and other financial institutions.
This is an important example of why investors should not blindly apply the same valuation multiple to every sector.
Which Is Better: P/E or EV/EBITDA?
There is no universal winner.
The better metric depends on what you are trying to understand.
Use P/E When You Want to Know:
“How much am I paying for the company’s earnings attributable to shareholders?”
P/E is especially useful when comparing profitable businesses with reasonably similar capital structures and economics.
Use EV/EBITDA When You Want to Know:
“How much am I paying for the operating business relative to EBITDA?”
EV/EBITDA can be especially useful when companies have different capital structures or when analyzing businesses at the enterprise level.
Use Both When You Want a More Complete Picture
For serious valuation analysis, the best approach is often not choosing between P/E and EV/EBITDA.
Instead, use both.
If both multiples suggest a similar valuation conclusion, that provides one piece of supporting evidence.
If they produce very different signals, investigate why.
That difference may reveal something important about the company’s:
- Debt
- Interest expense
- Depreciation
- Taxes
- Cash balance
- Non-operating income
- Earnings quality
- Capital intensity
In other words, the disagreement between valuation multiples can sometimes be more informative than the multiples themselves.
How to Use P/E and EV/EBITDA Together
A disciplined valuation process should not begin with the question:
“Which stock has the lowest P/E?”
Instead, begin by understanding the business.
Step 1: Understand the Business
Before looking at valuation, understand how the company makes money.
Consider its products, customers, competitive environment, revenue sources and major costs.
A valuation multiple has meaning only when you understand the business behind it.
Step 2: Check Profitability
Examine:
- Revenue growth
- EBITDA margin
- EBIT margin
- Net profit margin
- ROE
- ROCE
A company with a low valuation multiple but deteriorating profitability may deserve a lower valuation.
Step 3: Examine the Balance Sheet
Look at:
- Total debt
- Net debt
- Cash
- Interest coverage
- Debt/EBITDA
- Debt repayment requirements
This step is particularly important when using EV/EBITDA.
Step 4: Compare P/E
Compare the company’s P/E with appropriate peers and, where useful, its own historical valuation.
But do not assume that historical averages automatically represent fair value.
The business may have changed.
Step 5: Compare EV/EBITDA
Perform the same exercise with EV/EBITDA.
Use comparable companies and make sure the earnings periods being compared are consistent.
Step 6: Investigate Any Large Difference
If P/E and EV/EBITDA tell different stories, investigate.
Ask:
Is debt causing the difference?
Is depreciation unusually high?
Are taxes different?
Are there one-time gains or losses?
Is non-operating income inflating net profit?
Does the business require substantial capital expenditure?
These questions are more valuable than simply deciding which multiple looks cheaper.
Step 7: Check Cash Conversion
Finally, examine whether EBITDA actually translates into cash.
Look at:
Operating Cash Flow − Capital Expenditure = Approximate Free Cash Flow
The exact definition of free cash flow can vary depending on the analytical framework, but the principle is important: profitability and cash generation are not identical.
What Does a “Good” P/E or EV/EBITDA Ratio Look Like?
There is no universal number that makes a company cheap or expensive.
A P/E of 10× can be expensive for one business and attractive for another.
Similarly, an EV/EBITDA of 8× can represent very different levels of value depending on growth, profitability, debt, industry economics and future expectations.
Instead of asking:
“Is 10× P/E cheap?”
ask:
“10× compared with what?”
Compare the multiple with:
- Direct competitors
- Historical valuation
- Expected earnings growth
- Profit margins
- Return on capital
- Balance-sheet strength
- Business quality
- Cyclicality
- Industry economics
Why a Low Multiple Isn’t Automatically Cheap
A low multiple can indicate that the market expects weak future performance.
For example, a company might trade at 8× earnings because:
- Revenue is declining.
- Margins are shrinking.
- Debt is increasing.
- Its industry is structurally deteriorating.
- Earnings are temporarily inflated.
- Future cash flows may be weak.
This is sometimes described as a value trap.
A low valuation multiple is therefore a starting point for investigation—not proof of undervaluation.
Why a High Multiple Isn’t Automatically Expensive
A high multiple can reflect strong expectations.
A company with:
- High growth
- Strong margins
- High returns on capital
- Low financial risk
- Durable competitive advantages
- Significant future cash-flow potential
may trade at a higher multiple than a slower-growing competitor.
The important question is whether the company’s future performance can justify the expectations embedded in the current valuation.
Trailing vs Forward P/E and EV/EBITDA
Another important distinction is whether the denominator uses historical or expected earnings.
Trailing P/E
Trailing P/E uses earnings from a completed historical period.
For example:
Current share price ÷ past 12-month EPS
It is based on actual reported earnings, although those earnings may include unusual items.
Forward P/E
Forward P/E uses estimated future earnings.
For example:
Current share price ÷ expected EPS
Forward P/E can be useful when future earnings are expected to differ materially from historical earnings.
However, estimates are assumptions, not facts.
If projected earnings turn out to be wrong, the apparent valuation can change substantially.
Trailing EV/EBITDA
Trailing EV/EBITDA uses historical EBITDA.
Forward EV/EBITDA
Forward EV/EBITDA uses expected future EBITDA.
When comparing companies, make sure you understand whether you are looking at trailing or forward numbers.
Comparing a trailing P/E for one company with a forward P/E for another can produce a misleading conclusion.
Common Mistakes Investors Make With P/E and EV/EBITDA
Mistake 1: Treating a Low Multiple as a Buy Signal
A low P/E or EV/EBITDA does not automatically mean that a company is undervalued.
The multiple may be low because the company’s fundamentals are deteriorating.
Mistake 2: Comparing Different Industries
A software company, bank, cement manufacturer and utility company can have completely different economic characteristics.
Comparing their valuation multiples without considering those differences is rarely meaningful.
Mistake 3: Ignoring Debt
P/E can be significantly affected by interest expense and capital structure.
Investors should never examine P/E without understanding the balance sheet.
Mistake 4: Treating EBITDA as Cash Flow
EBITDA ignores capital expenditure and working-capital requirements.
A company can have excellent EBITDA and weak free cash flow.
Mistake 5: Blindly Accepting Adjusted EBITDA
Companies sometimes publish “adjusted EBITDA” that removes certain expenses.
Investors should understand what has been adjusted and whether those expenses are genuinely non-recurring.
If an expense occurs every year, calling it exceptional does not necessarily make it economically irrelevant.
Mistake 6: Ignoring Cyclical Earnings
A cyclical company’s earnings can be unusually high near the top of its cycle.
That can make P/E appear deceptively low.
Mistake 7: Comparing Different Accounting Periods
Make sure the numerator and denominator correspond to appropriate periods.
A valuation multiple is only meaningful when its components are consistently defined.
Mistake 8: Looking at Only One Valuation Multiple
P/E and EV/EBITDA should be viewed as tools within a broader analytical process.
Other metrics and financial statements can reveal risks that one multiple cannot.
P/E vs EV/EBITDA vs Other Valuation Multiples
P/E and EV/EBITDA are only two parts of the valuation toolkit.
P/E vs P/B
The price-to-book ratio compares market capitalization with shareholders’ equity.
P/B can be particularly relevant for financial institutions where the balance sheet itself is central to the business model.
P/E vs EV/EBIT
EV/EBIT uses earnings before interest and taxes.
Unlike EBITDA, EBIT includes depreciation and amortization.
This can make EV/EBIT more informative for businesses where depreciation represents a meaningful economic cost.
EV/EBITDA vs EV/Revenue
EV/revenue can be useful when a company has negative EBITDA or very immature profitability.
However, revenue does not tell you how efficiently the company converts sales into profit or cash.
A high-revenue company can still destroy shareholder value.
Valuation Multiples vs DCF
Multiples are generally relative valuation tools.
A discounted cash flow, or DCF, attempts to estimate the present value of expected future cash flows.
Neither approach is automatically superior.
Multiples are often faster and easier to compare across companies, while DCF analysis can make assumptions about future cash flows, growth and discount rates more explicit.
In practice, experienced analysts may use multiple valuation methods and investigate why they produce different results.
A Practical Valuation Checklist for Beginners
Before drawing conclusions from P/E or EV/EBITDA, work through this sequence:
Business → Growth → Margins → Debt → P/E → EV/EBITDA → Cash Flow → Peer Comparison → Historical Valuation → Risks
The goal is not to find the lowest number.
The goal is to understand what the number is telling you about the business.
For example, if a company has:
- Low P/E
- Low EV/EBITDA
- Falling revenue
- Falling margins
- High debt
- Weak cash flow
the low multiples should not automatically be interpreted as an opportunity.
On the other hand, a company with higher multiples but strong growth, high returns on capital, strong cash generation and a robust balance sheet may deserve a different analysis.
The valuation multiple is only one part of the story.
P/E Ratio vs EV/EBITDA: Key Takeaways
The most important lessons are:
- P/E compares equity value with net income.
- EV/EBITDA compares enterprise value with EBITDA.
- P/E is more directly affected by interest, taxes and capital structure.
- EV/EBITDA reduces some of the effect of financing differences.
- EV/EBITDA can be useful when comparing companies with different debt levels.
- EBITDA is not free cash flow.
- A low valuation multiple does not automatically mean a stock is undervalued.
- A high multiple does not automatically mean a stock is overvalued.
- Banks and other financial companies require different valuation approaches.
- Using P/E and EV/EBITDA together can provide a more complete picture than relying on either one alone.
Frequently Asked Questions About P/E vs EV/EBITDA
Is EV/EBITDA better than P/E?
Not universally. EV/EBITDA can be more useful for comparing businesses with different capital structures, while P/E directly relates equity value to net income. The appropriate metric depends on the company and the analytical question.
Why is EV/EBITDA preferred over P/E?
EV/EBITDA is often preferred for operating comparisons because enterprise value incorporates debt and cash while EBITDA excludes interest and taxes. This can make comparisons between companies with different financing structures more meaningful.
However, EV/EBITDA also ignores important economic costs, particularly capital expenditure, so it should not be treated as universally superior.
What is the main difference between P/E and EV/EBITDA?
P/E compares equity value with net income, whereas EV/EBITDA compares enterprise value with EBITDA.
P/E focuses on shareholder earnings. EV/EBITDA focuses more on the value of the operating business.
Can a company have a low P/E but a high EV/EBITDA?
Yes. Differences in debt, cash, depreciation, taxes, interest and non-operating income can cause the two multiples to produce very different results.
If the difference is significant, investors should investigate the company’s financial statements rather than assuming one ratio is wrong.
Can EV/EBITDA be negative?
If EBITDA is negative, the conventional EV/EBITDA multiple becomes negative or otherwise economically difficult to interpret.
A negative multiple should not be treated as evidence that a company is cheap.
In such situations, other valuation approaches may be more appropriate.
What does a 10× EV/EBITDA mean?
A 10× EV/EBITDA means the company’s enterprise value is 10 times its EBITDA.
It does not guarantee that investors will recover their investment in 10 years because EBITDA is not free cash flow.
What does a 20× P/E ratio mean?
A 20× P/E means the company’s equity value is 20 times its annual earnings, or equivalently, the share price is 20 times its EPS.
It does not mean the investment will necessarily pay itself back in exactly 20 years.
Which is better for companies with high debt: P/E or EV/EBITDA?
EV/EBITDA can often provide a more useful operating comparison because EBITDA excludes interest expense and enterprise value explicitly incorporates debt.
However, high debt remains a major financial risk and should be analyzed separately.
Which valuation multiple is better for banks: P/E or EV/EBITDA?
P/E is generally more useful than EV/EBITDA for banks because interest is fundamental to banking operations.
Other metrics such as P/B and ROE can also be particularly important when analyzing financial institutions.
Can you calculate P/E from EV/EBITDA?
Not directly.
You need additional information about debt, cash, depreciation, interest, taxes and other factors connecting enterprise value to equity value and EBITDA to net income.
Should investors use P/E and EV/EBITDA together?
Yes, using both can provide a more complete valuation perspective.
P/E helps you understand the relationship between equity value and shareholder earnings, while EV/EBITDA helps you evaluate the operating business independently of some financing differences.
Is a lower P/E always better?
No.
A low P/E can reflect weak growth, high financial risk, declining earnings, cyclical peak profits or other fundamental problems.
The correct question is not simply whether P/E is low, but whether the valuation is reasonable relative to the company’s future earnings potential and risks.
Conclusion: P/E vs EV/EBITDA Is About Asking the Right Question
P/E and EV/EBITDA are both valuable valuation tools, but they answer different questions.
P/E asks:
How much am I paying for the earnings attributable to shareholders?
EV/EBITDA asks:
How much am I paying for the operating business relative to EBITDA?
That distinction explains why the two multiples can produce different results for the same company.
P/E can be particularly useful when analyzing profitable companies and shareholder earnings. EV/EBITDA can be especially useful when comparing operating businesses with different capital structures or when analyzing enterprise-level transactions.
But neither should be used in isolation.
A responsible valuation analysis should consider growth, profitability, debt, cash generation, capital expenditure, competitive position, industry economics, historical valuation and business risk.
Most importantly, investors should resist the temptation to interpret a low P/E or EV/EBITDA as an automatic buy signal. A valuation multiple reflects both the company’s current financial performance and the expectations embedded in its market value.
The real skill in valuation is therefore not memorizing whether a particular multiple is “good” or “bad.”
It is learning to ask:
Why is this company trading at this multiple, and are the assumptions behind that valuation reasonable?
That is the foundation of better financial analysis—and a much safer way to use valuation ratios than relying on a single number to make an investment decision.
This article is for educational purposes only and does not constitute investment advice, a recommendation to buy or sell any security, or a guarantee of future returns. Investors should conduct independent research and consider their financial circumstances and risk tolerance before making investment decisions.
Related Posts:
- Financial Ratios Explained: PE, PB, ROE & How to Analyze Any Stock
- Price to Sales Ratio (P/S): Formula, Meaning & Calculation
- What Is the Price-to-Book Ratio? Formula, Meaning & Examples
- P/E Ratio: Meaning, Formula, Examples & How to Analyze It
- What Is EBITDA? Meaning, Formula, Calculation & Examples
- What Is the PEG Ratio? Formula, Calculation, Meaning, and How to Use It
- What Is EPS? Earnings Per Share Explained With Formula, Examples & How to Analyze It
- How to Value a Stock: Complete Stock Valuation Guide

You may also like

Price to Sales Ratio (P/S): Formula, Meaning & Calculation

What Is the Price-to-Book Ratio? Formula, Meaning & Examples